
 Celestia
 Pearl
Pearl Quantus
 Zcash
Zcash Hyperliquid
 Injective
 NEAR Protocol
- WIF has declined by 57% in the past 3 weeks and shows a directional move.
- Technical indicators were supporting the bearish momentum at press time.
According to the chart structure, WIF has displayed weakness over the past few weeks. It dropped 35% from a rising channel in 10 days. The price has slipped below the major support level of $2 and is heading for a new all-time low.
Since mid-April, the Dogwifhat price has displayed slow and steady growth and risen by taking support on a trendline. In the 2nd week of June, the price failed to defend the trendline and witnessed selling pressure.
At press time, the WIF price traded at $1.79 which has gained 2.12% in the past 24 hours. The market capitalization is $1.80 Billion and the 24-hour trading volume is $423.23 Million. The fully diluted market cap is $1.800 Billion.
Dogwifhat Price Dropped Below $2 Level; Will it Bounce Back After a Liquidity Grab?
Based on the technical chart, WIF price has dropped below the $2 level, displaying sellers’ strength. A small negative pullback is expected.
If the buyers lift the price over the $2 mark then most of the sellers might face difficulty and would hit stop-loss. Below the $2 mark, liquidity might grab which may result in a sharp buying pressure.
On the other hand, if the price manages to sustain below the $2 mark, sellers may become confident. The price below the $2 mark is a bearish sign and sellers may eye for a new all-time low.
The technical indicators suggest that the Dogwifhat crypto price is below the key moving averages, showcasing a bearish forecast. MACD has developed continuous red histograms and the signal line is below the Zero line. The technical indicators are highlighting bearish momentum.
Technical Analysis of WIF Price on 4-H Timeframe
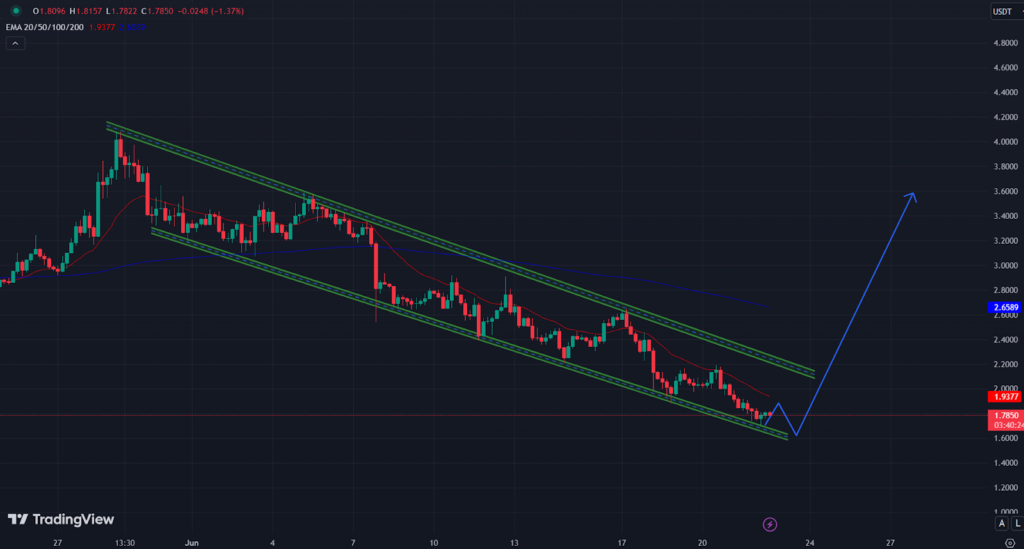
BINANCE: WIF/USD 4-H Chart By Tradingview
On a 4-H time frame, the Dogwifhat crypto price has been falling through a channel. Currently, the price is taking support on the trendline and below the key moving averages.
Assuming the WIF crypto price triggers a breakout from the channel and trading volume increases, strong buying pressure can be expected. If the price exceeds the 200-day EMA, buyers can be attracted which may lead to a bullish momentum for the long term.
Alternatively, if the buyers fail to bounce back then sellers may dominate further. It may difficult for the buyers to bounce back from below the channel.
Conclusion
WIF price seems to be facing significant downward pressure. The breach of the $2 level indicates strong selling momentum, which could lead to further decline and a new all-time low. However, a potential bounce-back cannot be ruled out entirely, especially if the price surpasses the $2 mark, leading to a possible short-term buying pressure. Overall, the current market conditions suggest a bearish outlook for the WIF price, as indicated by the technical indicators and recent price behavior.
Technical Levels
The Dogwifhat price is expected to face resistance from the $2.60 and $3.50 levels. The price may take support at the $1.50 and $1.00 mark.
Disclaimer
This article is for informational purposes only and provides no financial, investment, or other advice. The author or any people mentioned in this article are not responsible for any financial loss that may occur from investing in or trading. Please do your research before making any financial decisions.




