
 Quantus
 Injective
 Bitcoin
 Quant
Quant Pudgy Penguins
 Raydium
 Bittensor
- A huge surge in the traded volume of the INJ token has been recorded in the last 24 hours.
- The price volatility of the token is certainly high (7.08%).
The volume/market cap ratio of the INJ token is 7.0%, indicating high liquidity.
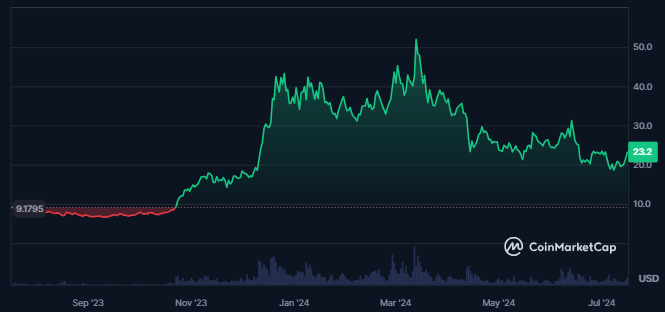
The market cap and the value of the token’s traded volume have increased over the last 24 hours, showing a surge in the token’s demand among investors and traders.
At press time, the market cap of the Injective token was valued at $2.168B, and the value of the traded volume of the token is $152.964 Million. Also, Injective is the 44th largest crypto in the global crypto market.
The supply inflation of the token has been high, resulting in 16.74%, and the sentiment for the token is neutral. Despite this, the fear and greed index of the token was at 65, which indicated greed among the investors.
Injective Protocol token has 42.9K holding addresses, and 35% are in profit. Also, the whales concentration is higher in the token, resulting in 94%. Additionally, 21% of the addresses have held the token for over a year.
Injective Token Derivatives Data Analysis
A higher short liquidation worth $159.39K was recorded in INJ over the last 24 hours, highlighting positive sentiments for the token.
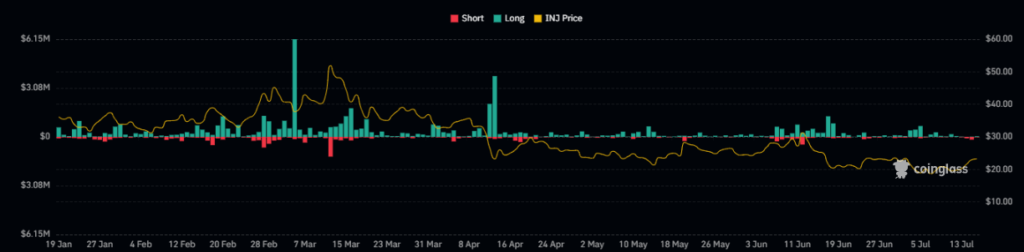
The liquidation chart indicated a decline in liquidation activity. It showed a decline in the average number of derivatives traders for the INJ token.
Additionally, the derivatives trading volume for the token has advanced by 64% over the last 24 hours, followed by the open interest, which has also advanced by 8.3%. Moreover, the traded value of the derivatives in the last 24 hours is $281.68 Million.
INJ Token Technical Analysis
After declining to certain lows, INJ started to witness buying from the lower levels, followed by the formation of strong bullish candles.
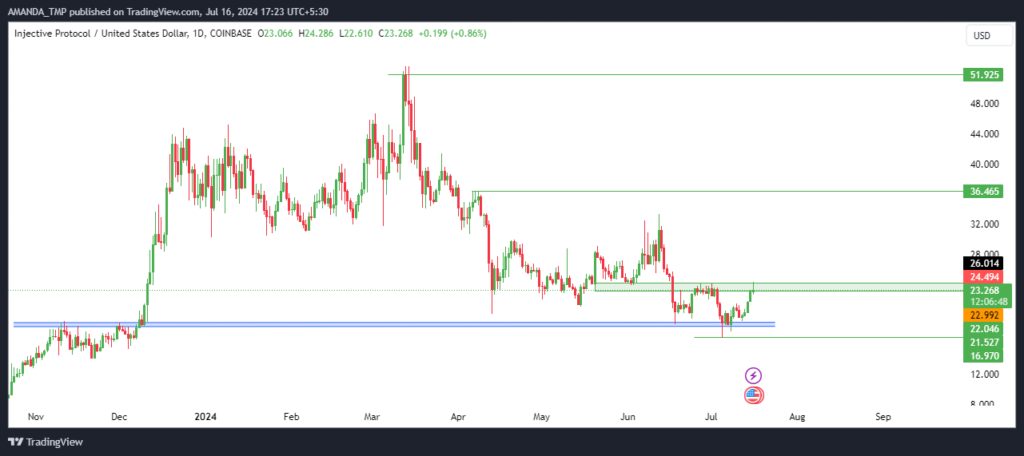
INJ witnessed strong profit booking for a long time, followed by the formation of lower highs on the technical chart. This exhibited bearish behavior in the price of Injective token.
Additionally, over the last few days, the token started to advance, leading to a strong change of character level (CHOCH). If the token breaks above the CHOCH level and is sustained above the same, a surge is likely.
INJ/USD Chart by TradingView
Most commonly known EMAs, like the 50-day and the 200-day EMAs, are trading in a death cross while the token’s price has broken above the 50-day EMA.
The price might take rejection from its current levels and continue to decline to lower levels. However, if the price breaks above the 200-day EMA and sustains above the same, a surge in the price might be seen.
The RSI exhibits bullish behavior in the momentum of the price as it has broken above the 50-level. This is followed by a breakout above the 14-day SMA on the daily chart.
INJ Displays Mixed Signals
INJ displayed mixed signals with a surge in trading volume and market cap, reflecting high demand.
However, major holders remain at a loss, and the price faces potential resistance at the 200-day EMA. While the RSI reflects bullish momentum, the overall sentiment is uncertain, reflecting cautious investor optimism.
The support levels for INJ are $14.00 and $21.50, followed by the resistance levels of $36.50 and $52.00.
Disclaimer
This article is for informational purposes only and does not provide any financial, investment, or other advice. The author or any people mentioned in this article are not responsible for any financial loss that may occur from investing in or trading. Please do your research before making any financial decisions.




