
 Dacity Coin
 Celestia
 Quantus
 Bitcoin
 Pearl
Pearl Pons
Pons Injective
- The TRU crypto derivatives volume has witnessed a massive surge.
- The TrueFi price has advanced by 240% in the last one year.
In the last few months, TrueFi (TRU) has seen a downtrend, gradually declining from the higher levels. This bearish momentum led to the formation of lower highs on the chart, suggesting sustained selling pressure.
However, the most recent price action hinted at a potential shift in the market sentiment. This happened as the TRU price broke out above a crucial swing high.
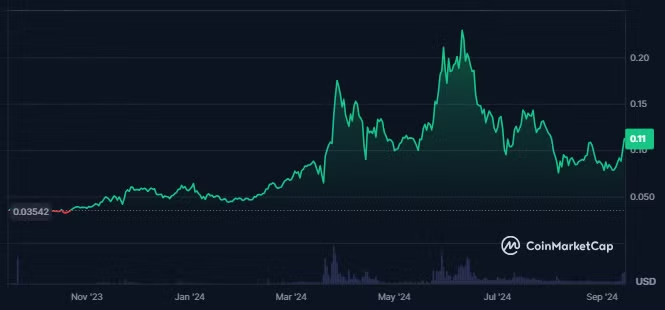
TRU Price Analysis: Market Sentiment and Volatility
When writing, the TrueFi crypto was the 282nd-largest cryptocurrency with a market capitalization of $129.97 Million. This gave the token a market cap dominance of 0.01%, highlighting its notable presence in the broader crypto space.
In the last 24 hours, TrueFi’s trading volume has surged by 115%, reflecting growing demand for the token. This increase brought the total traded value to $54.534 Million, accounting for 42.18% of the token’s market cap. Such figures indicate strong liquidity, contributing to potential price fluctuations in the short term.
The TRU Token price exhibited high volatility, which may lead to unpredictable price movements in the near future. Despite this volatility, investor sentiment remained bullish, as indicated by Coincodex. The Fear and Greed Index for the token stood at 50, reflecting neutral sentiment among investors.
However, the fundamentals of the project showed some weakness. The Total Value Locked (TVL) for TrueFi was $255K, signaling a decline in the project’s overall strength.
On a security level, TrueFi was ranked 1,024th globally, with a security score of 77. This placed it within the BBB tier, which indicates moderate reliability.
Derivatives of TrueFi Crypto Witnessed Strong Demand
Traders’ interest in TrueFi crypto has surged, leading to a 270% increase in the token’s trading volume. This rise in activity brought the total traded value to $173.90 Million, underscoring heightened demand for the asset.
TrueFi’s open interest also saw a 27% increase, with a traded value of $20.72 Million. This reflected a growing number of open derivative positions.
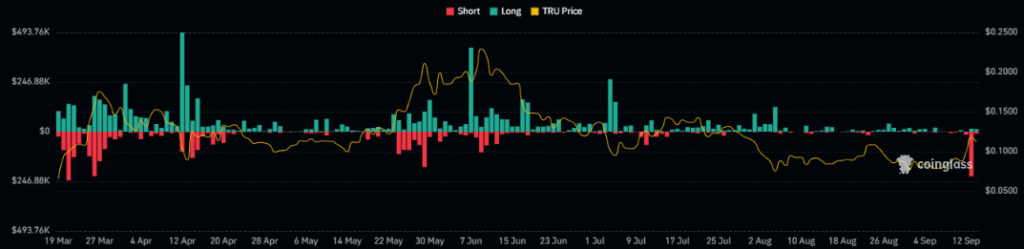
Over the past 24 hours, short positions worth $218K were liquidated, continuing the trend of elevated short liquidations observed recently. This suggested increased pressure from sellers. However, it also pointed to potential reversals as these positions are closed.
In contrast, long liquidations totaled $17.87K during the same period. It indicated a relative dominance of buyers in shaping the TrueFi price action. This dynamic, coupled with the growing open interest, suggests that market participants anticipate further price movements in the token.
Let’s examine the significant levels at which TRU Token broke out
The TRU price started to decline after forming a heading-shoulders pattern on the chart. The following behavior in the price led to the formation of multiple lower lows and lower highs on the chart. This showed a bearish trend in the token price.
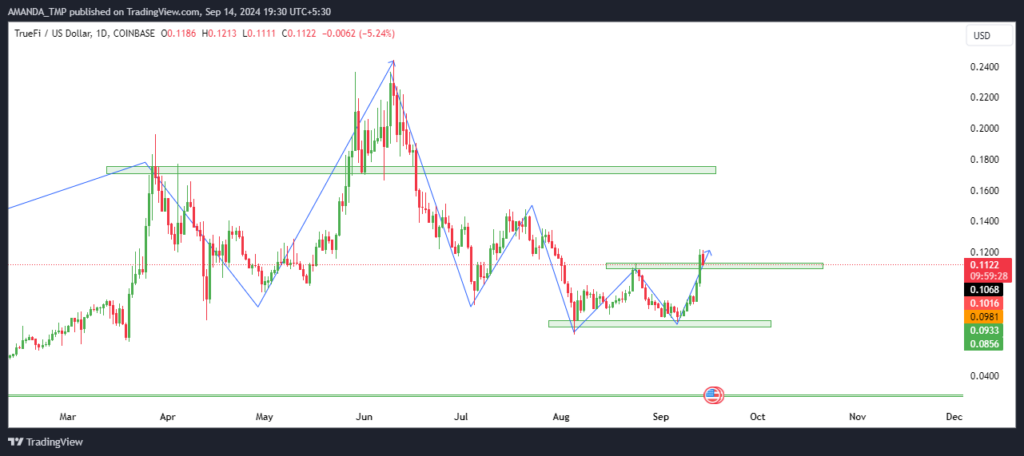
Looking further into the most recent price action, we will see that the TRU price has started to witness some buying from the lower levels. The token price broke above a crucial swing high of $0.110. This showed the buyers’ dominance in the price.
Additionally, strong bullish candles could be seen on the chart. This showed a higher possibility of further surges in token prices.
TRU Token Price Breaks Above Crucial EMAs
The TRU crypto price at press time broke above the 50 and the 200-day EMA. Despite this, following the prior trend, the EMAs traded in a death cross.
If the TrueFi price continues to surge to higher levels, we might see the golden cross on the chart.
TRU/USD Chart by TradingView.com
The MACD indicator further showed volatility in the TRU price as the MACD and the signal line traded in a golden cross. Despite this, both the metrics sustained a negative trajectory.
The RSI broke above the 14-day SMA and sustained above the 50-level. This showed a strong surge in the token’s price momentum.
The support levels for the TRU token are $ 0.690 and $0.090, followed by the resistances of $0.140 and $0.240.
Disclaimer
This article is for informational purposes only and does not provide any financial, investment, or other advice. The author or any people mentioned in this article are not responsible for any financial loss that may occur from investing in or trading. Please do your research before making any financial decisions.




