
 Dacity Coin
 Celestia
 Bitcoin
 Pearl
Pearl Quantus
 Injective
 Hyperliquid
- BONK price has surged by 200% in the past 2 weeks.
- The 24-hour trading volume has increased by 108%, which shows new engagement.
Bonk’s (BONK) price has triggered a breakout from a wedge pattern with massive buying pressure. It has climbed by 200% in the last two weeks and has reached an all-time high (ATH) today (Nov 20).
The chart structure has displayed single-directional moves for the past few days. The BONK price has triggered a pullback in the short term and has surged by 15% in 12 hours.
With a powerful upward advance, this breakout stood out from the previous downtrend and resistance levels inside the wedge.
The 200-day moving average, or EMA, indicated that the BONK price eventually broke above. It maintained its position following multiple touches and rejections from this moving average.
Technical Analysis of BONK Price Over 1-D Timeframe
BONK crypto traded at $0.0000554 when writing, with an intraday gain of 6.18%. The market capitalization was $4.17 Billion, and the 24-hour trading volume was $3.07 Billion.
BONK crypto price has smashed the major resistance level of the $0.0000400 mark and showed good momentum. The price would remain bullish over that level. Moreover, it could generate a selling signal once the price starts trading below this.
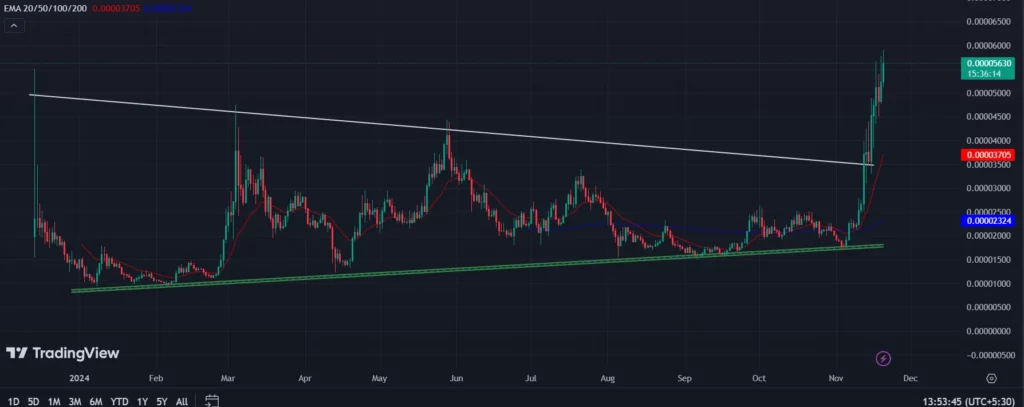
If the price sustains over the $0.00004700 mark, it could keep rising by recording new ATHs. Suppose the chart structure manages to attract investors; massive buying can be seen for a longer period.
Alternatively, if the digital asset price starts trading below the $0.0000470 mark, sellers may drag down the price to $0.000040. Profit booking can be seen once the price loses the $0.0000400 line. Here, profit booking could lead to strong selling pressure.
OI-weighted funding rates Analysis
Furthermore, the BONK crypto’s OI-Weighted Funding Rate showed a steady rise in funding rates since the day of the US election. This indicated that investors are bullish and long traders have been paying short traders.
This pattern persisted unabatedly, with notable peaks that coincided with notable increases in BONK’s valuation. According to the chart, funding rates peaked just before significant price corrections.
It indicated that although market sentiment is still positive, traders should anticipate volatility and possible pullbacks after steep increases.
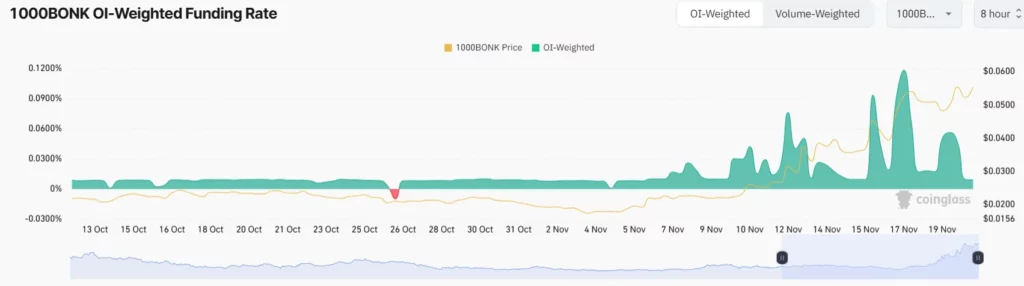
The chart indicated a potential pullback towards these dense liquidity pools located lower after BONK reached new ATHs.
BONK price may gain momentum by absorbing liquidity that has accumulated below its most recent peak during this possible retreat. That could act as a correction phase before it rises once more.
These kinds of movements support the idea that markets are cyclical. Moving forward, retracements are frequently required to prepare for subsequent runs following large rallies.
BONK Price Prediction Based on Chart
The BONK price has experienced a significant price surge in a short period, breaking through key resistance levels. It reached an all-time high.
The strong trading volume and positive technical indicators suggested that the momentum could continue, encouraging further investment. However, traders must monitor critical support and resistance levels closely.
If BONK can maintain its price above critical thresholds, it may lead to new highs. Conversely, any movement below the established support levels could trigger profit-taking and increased selling pressure.
Disclaimer
This article is for informational purposes only and provides no financial, investment, or other advice. The author or any people mentioned in this article are not responsible for any financial loss that may occur from investing in or trading. Please do your research before making any financial decisions.




