
 streamoors
 Altai the Tiger
 Sword Inu
 IGNITION
 no crying in the casino
 Quantus
 NEAR Protocol

Key Insights:
- Ethereum open interest falls from $7.7B to $3.1B since December 2024.
- ETH/BTC pair hits historical support near 0.02 BTC zone.
- Monthly RSI near 3-year low, reflecting weak momentum and low demand.
Sharp losses in the cryptocurrency market have shown early signs of recovery. Ethereum is trading around $1,600, and Bitcoin has climbed back close to $80,000. However, investor sentiment around Ethereum remains bearish. According to recent data from CryptoQuant and technical indicators, traders are becoming more cautious.
Ethereum’s open interest is falling, its position against Bitcoin is weakening, and historical RSI patterns suggest reduced demand. Broader financial developments—such as U.S. stock market reactions to recent tariff news—have also influenced short-term price action.
Binance Drops Over 50% of Ethereum’s Open Interest
CryptoQuant data shows that Ethereum’s price open interest in Binance has dropped sharply. Open interest reached a peak of $7.7 billion on December 16. But by early April 2025, it has fallen below $3.1 billion. That is a drop of more than $4 billion in four months.
The 365-day moving average of open interest is now below its current level. This suggests a longer-term change in the way traders are acting. It implies that there are fewer leveraged positions. It also suggests growing caution or the absence of confidence among traders who use Binance, the largest exchange by trading volume.
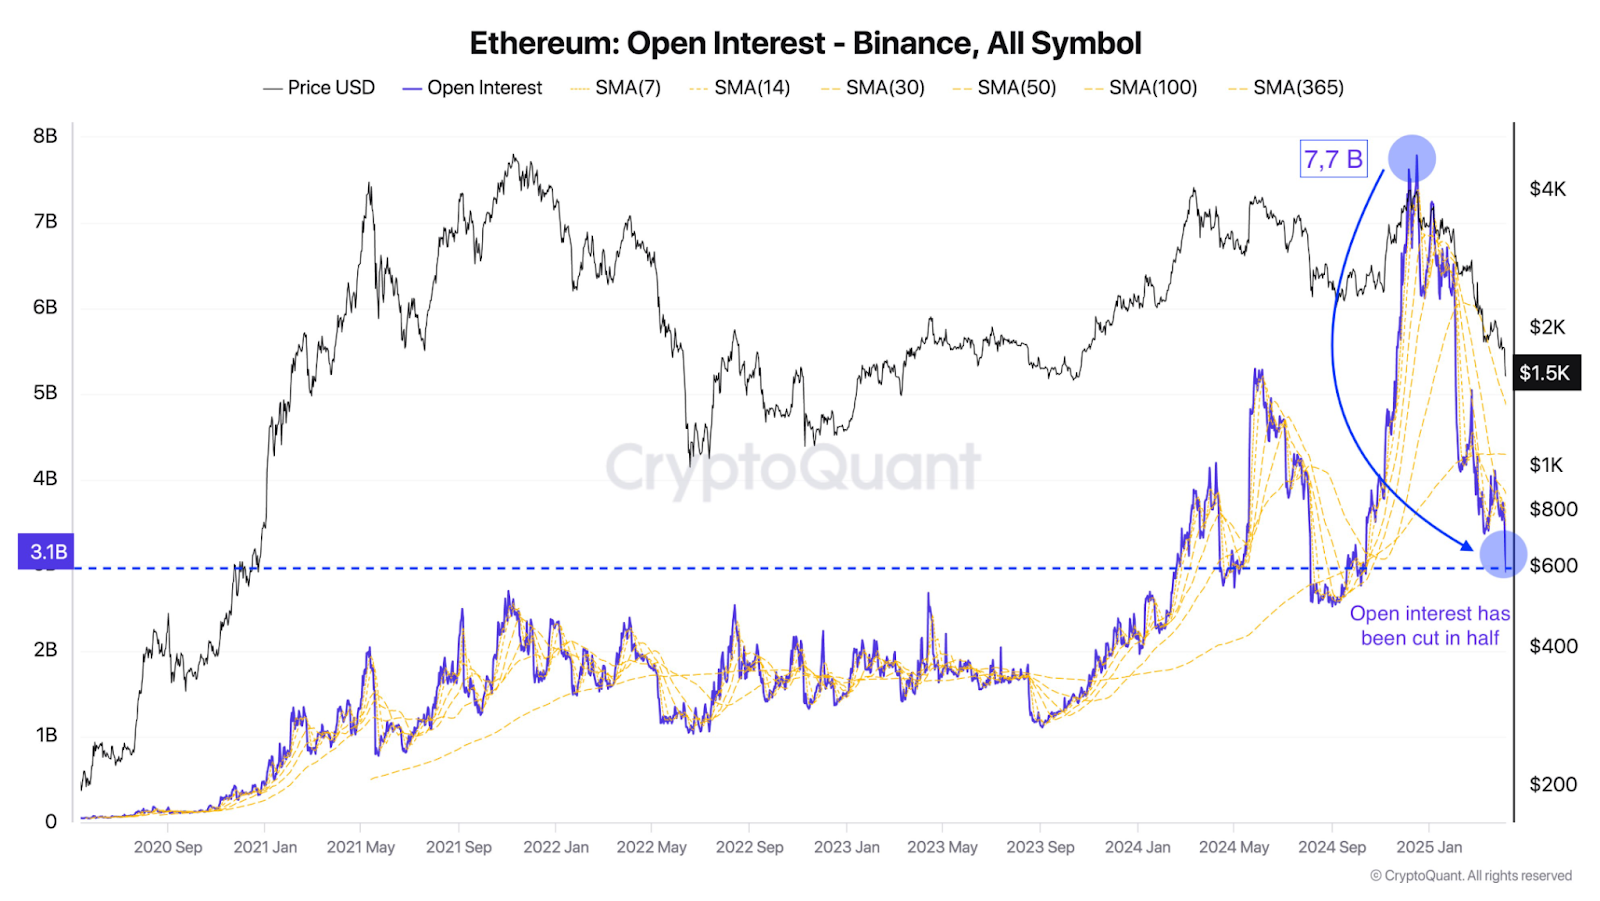
The report states that open interest has been cut in half. The move comes after recent price volatility and is likely due to reduced speculative activity. Such a steep decline usually follows heavy liquidations or market exits.
Along with this drop in open interest, the Ethereum price has fallen. Ethereum was trading around $4,000 at the beginning of this drop. Since then, it has declined to about $1,500. That’s a loss of over 60%. If open interest keeps declining, Ethereum may not be able to stabilize.
ETH/BTC Pair at Historical Support
Meanwhile, CryptoELITES also has a separate chart for the Ethereum to Bitcoin (ETH/BTC) trading pair. Now the pair has returned to a major support zone around 0.02 BTC. In the past, price reversals have been marked in this support area.
ETH/BTC last reached this level in 2019. Following that point, the pair rallied for a number of months. This zone is often watched by analysts because it represents when Ethereum is historically undervalued relative to Bitcoin.
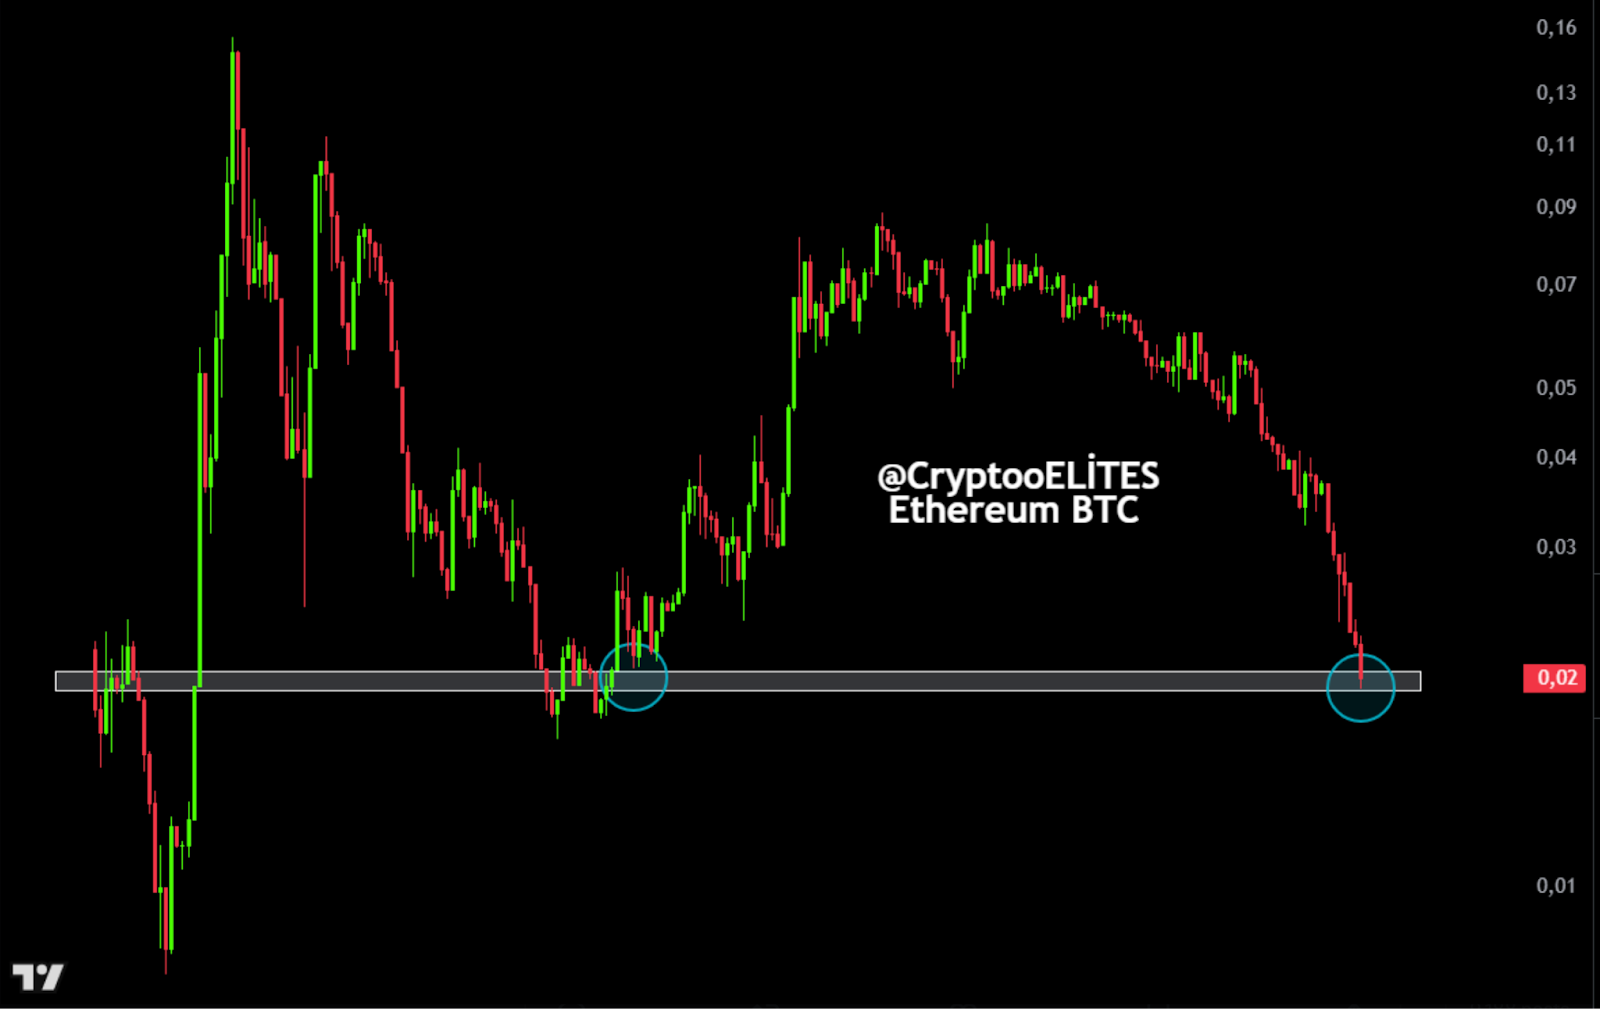
Now the ETH/BTC ratio is approaching the same level. If it breaks below this zone, Ethereum could underperform Bitcoin even more. But if it does hold, it could result in capital flowing back into ETH, especially from traders looking for value.
Ethereum RSI at Historically Low Levels
Moreover, CryptoRover also has another chart showing Ethereum’s monthly price and RSI (Relative Strength Index). RSI, a momentum indicator, is now near its lowest level in the last three years. It’s currently hovering just around 40.
Ethereum has historically recovered very well when the RSI has reached similar zones. Three previous periods — late 2018, mid-2022 and now in early 2025 — are marked on the chart where RSI entered oversold territory. In both the past cases, Ethereum entered a bull phase later.
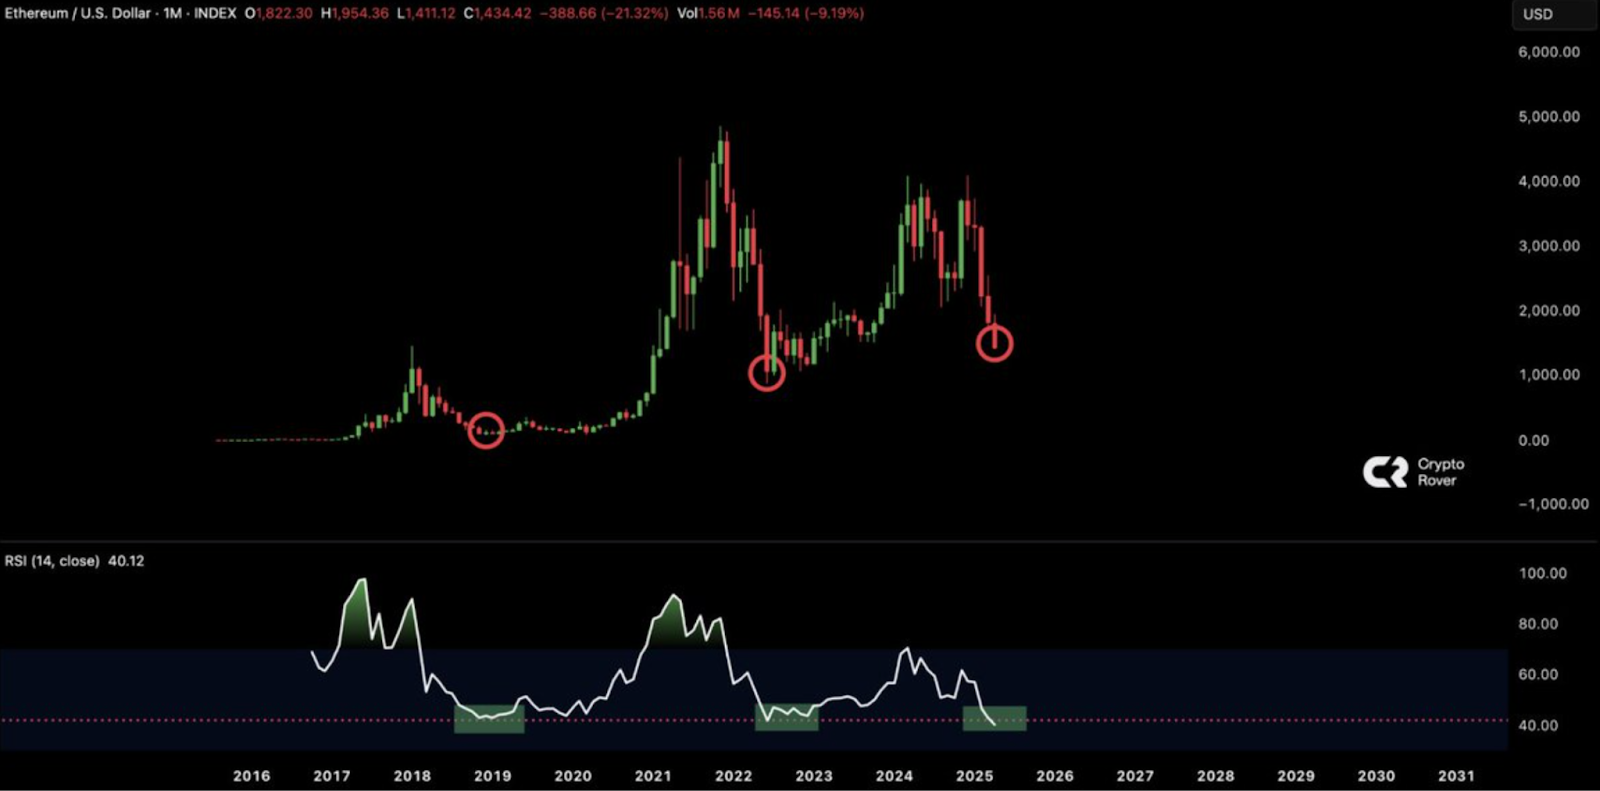
The RSI does not mean that price action will occur, but it is a good indicator of when an asset is undervalued. If previous patterns repeat, the market may be close to a bottom. The monthly chart of Ethereum also indicates that every time the price reached the RSI zone, it reversed.
Broader Market and Macro Pressures
The broader crypto market remains cautious. The total crypto market cap stands at $2.68 trillion. Liquidations over the last 24 hours hit $872.4 million. The Fear & Greed Index sits at 24, reflecting extreme fear.
Speculation about a U.S. tariff pause briefly lifted sentiment and sparked a short-lived rally in U.S. equities. The S&P 500 jumped 8% before gains faded.
The White House later denied the reports. President Trump followed with a threat to raise tariffs on China by 50% unless Beijing removes its own tariffs. These developments have renewed global market uncertainty, which tends to spill into crypto assets.
Disclaimer
This article is for informational purposes only and provides no financial, investment, or other advice. The author or any people mentioned in this article are not responsible for any financial loss that may occur from investing in or trading. Please do your research before making any financial decisions.




