Dacity Coin
 Celestia
 Bitcoin
 Pearl
Pearl Quantus
 Injective
 Hyperliquid

Key Insights:
- Realized Cap Impulse reaches historical support near the 0 baseline
- Long-term holders may define Bitcoin’s next trend direction
- Breakout pattern targets range between $96,200 and $102,100
Long-term holder activity and chart patterns suggest a major move on Bitcoin as it trades near a critical technical and behavioural zone. Current data suggests the supply and demand balance is being tested, with key data pointing to a possible breakout or breakdown.
Bitcoin Realized Cap Impulse Approaches Historical Support Zone
The Realized Cap Impulse indicator is an indicator that measures market sentiment using blockchain data. It is the difference between price and the average cost basis of coins last moved on chain. Now the indicator is near its lower support area.
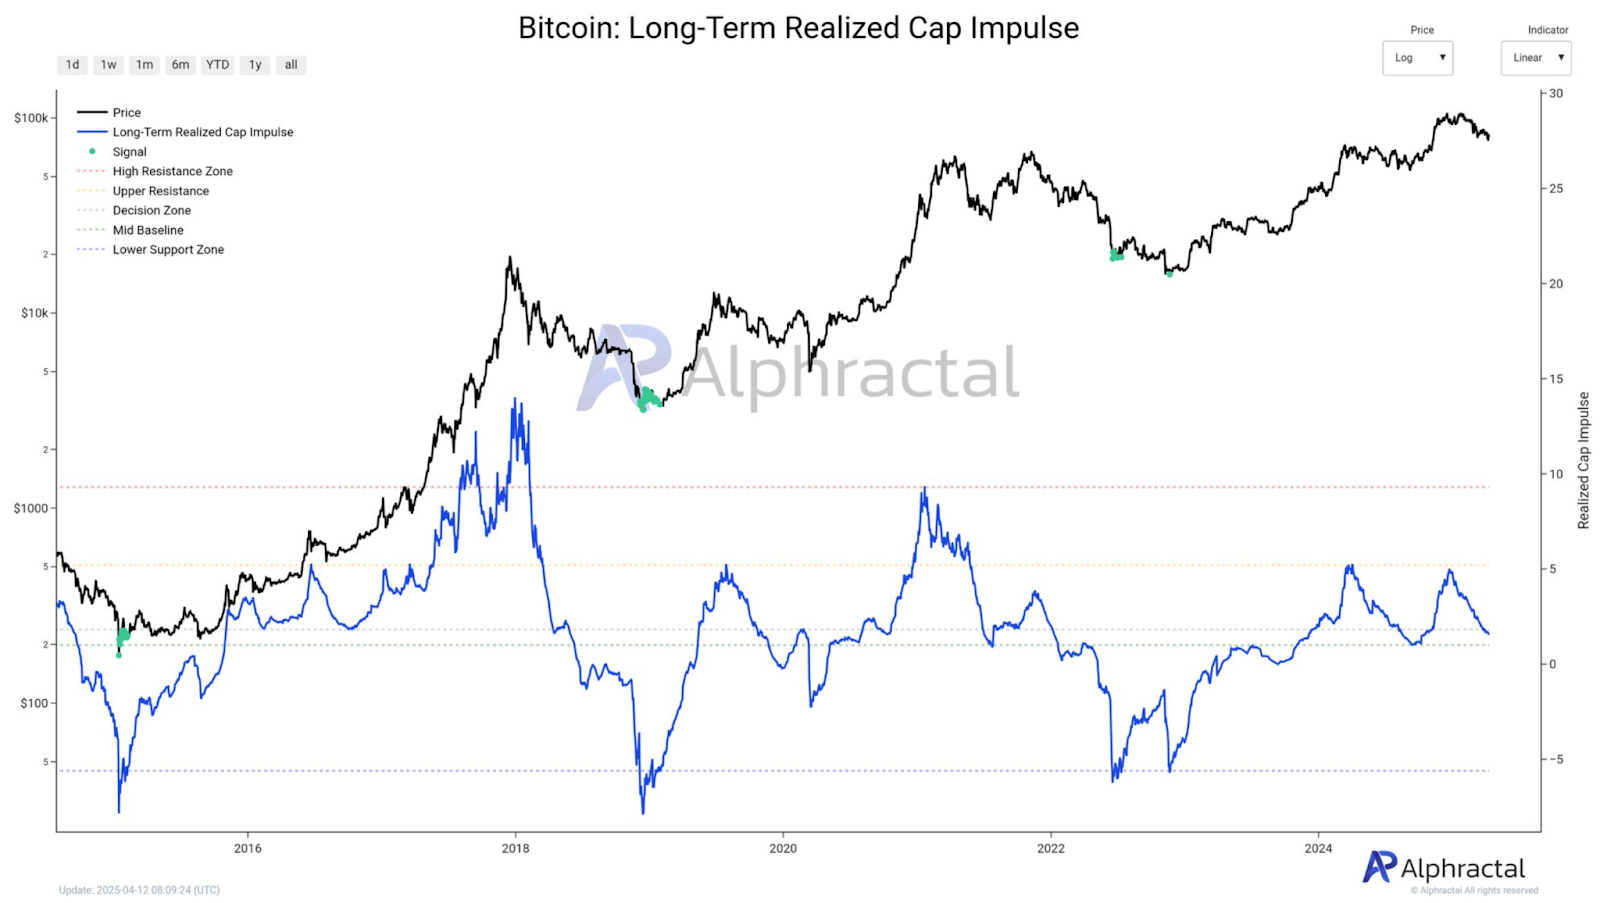
The chart above by Alphractal shows that the Long Term Realized Cap Impulse (LTCI) has fallen to the lower support zone.
Historically, this level has been a turning point. Currently, the blue line, which is the LTCI, is testing the green support area. Data has shown similar conditions in the past led to strong reversals, such as in early 2020 and mid-2024.
If LTCI rebounds from its current level of around 0.5 to 1.0, it may indicate long-term holders are confident. But if the line breaks below the 0 level, it would suggest that even the most patient investors are beginning to sell. That could add to downward pressure and result in further declines.
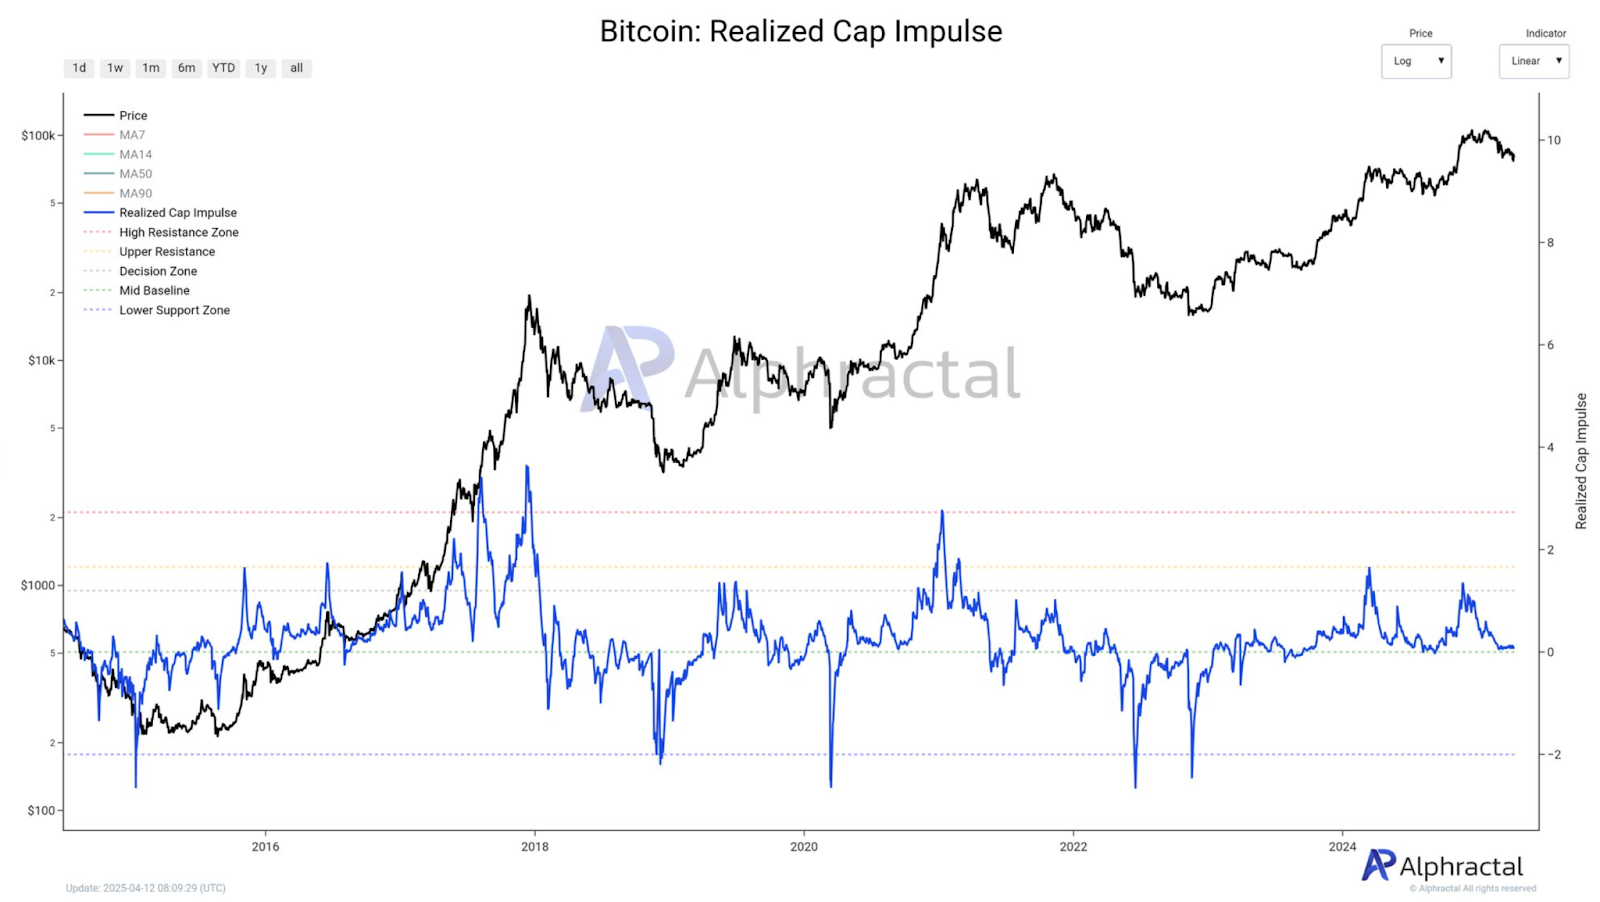
Moreover, the pattern is the same as the Realized Cap Impulse. Since early 2024, it has been fluctuating near the baseline, between the -1.0 and +2.0 range. On April 12, 2025, the indicator stays close to the green Decision Zone line. This could support price stability if it holds, but a break below could shift sentiment further.
Long-Term Holders May Define the Next Trend
The Long Term Realized Cap Impulse is concerned with long-term holders, i.e., investors who have held their Bitcoin for longer than 155 days. These holders are less likely to react to short-term price changes and tend to accumulate in downturns.
This group’s current behaviour is crucial. It may support the price and prevent large sell-offs if they continue holding or buying. However, if these holders start to exit, it may be an indication of a change in sentiment. However, this has happened before, like in the 2018 and 2022 market lows, when capitulation caused sharp drops.
This moment appears similar. Bitcoin’s price is currently around $84,590. As Alphractal’s chart shows, in previous cycles, price reactions followed long-term holder activity pretty closely. Given that the LTCI is near the lower threshold, the coming weeks will indicate if this group is stepping in or stepping out.
Wedge Breakout Targets $96K–$102K Zone
According to analyst Titan of Crypto, Bitcoin has broken out of a descending broadening wedge—a bullish reversal pattern. The breakout was marked by a move above the wedge’s upper boundary near $85,000.
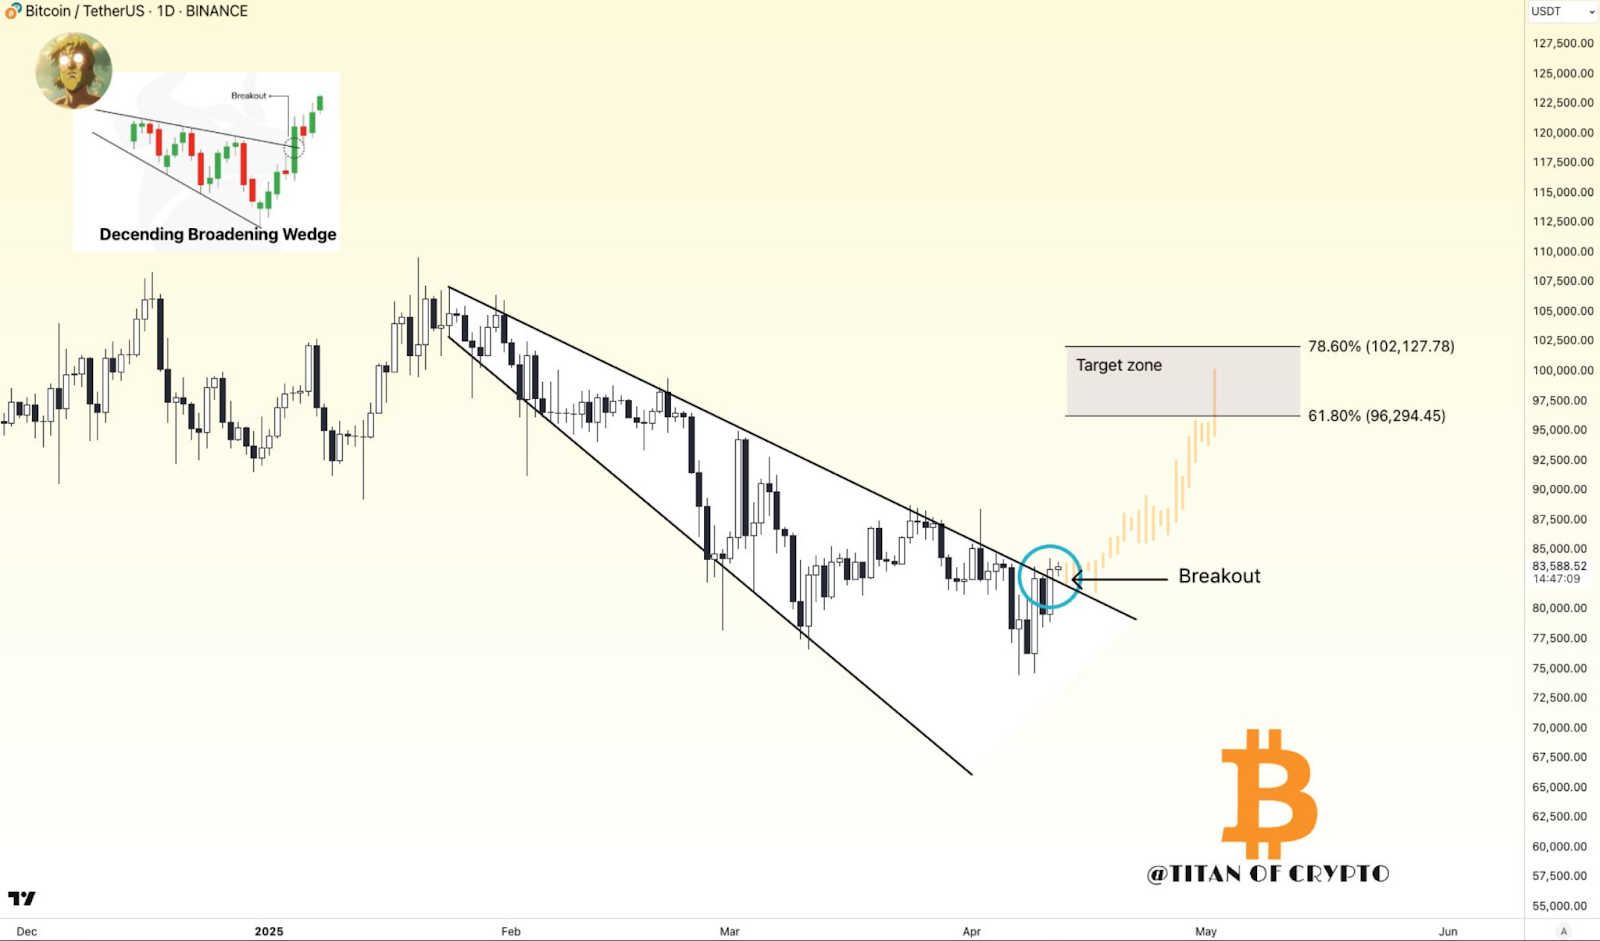
A blue circle marks the breakout point. Titan of Crypto projects a price range between $96,294 and $102,127—aligned with the 61.8% and 78.6% Fibonacci retracement levels from prior moves.
To confirm this breakout, Bitcoin must sustain closes above the wedge’s upper trendline. A successful retest could invite fresh buying interest. Conversely, failure to hold above this level might lead to a pullback below $80,000.
Disclaimer
In this article, the views and opinions stated by the author or any people named are for informational purposes only, and they don’t establish the investment, financial, or any other advice. Trading or investing in cryptocurrency assets comes with a risk of financial loss.