Celestia
 Pearl
Pearl Quantus
 Zcash
Zcash Hyperliquid
 Injective
 NEAR Protocol

Key Insights:
- Stablecoin market cap tops $231B, but 90-day inflows are showing signs of decline.
- Global liquidity hits $145T, supporting crypto but with caution for altcoin growth.
- Altcoin RSI flattens, mirroring past cycle peaks and suggesting weaker buying strength.
Stablecoin inflows into the crypto market have slowed despite rising global liquidity. While the total market cap for stablecoins exceeded $231 billion, the 90-day change curve turned lower. This decline could limit altcoin performance unless inflows recover.
Stablecoin Market Inflows Slow as Altcoin Demand Dips
According to Alphractal, total stablecoin market cap sits above $231 billion. However, the 90-day variation is now dropping—similar to the early 2021 cycle.
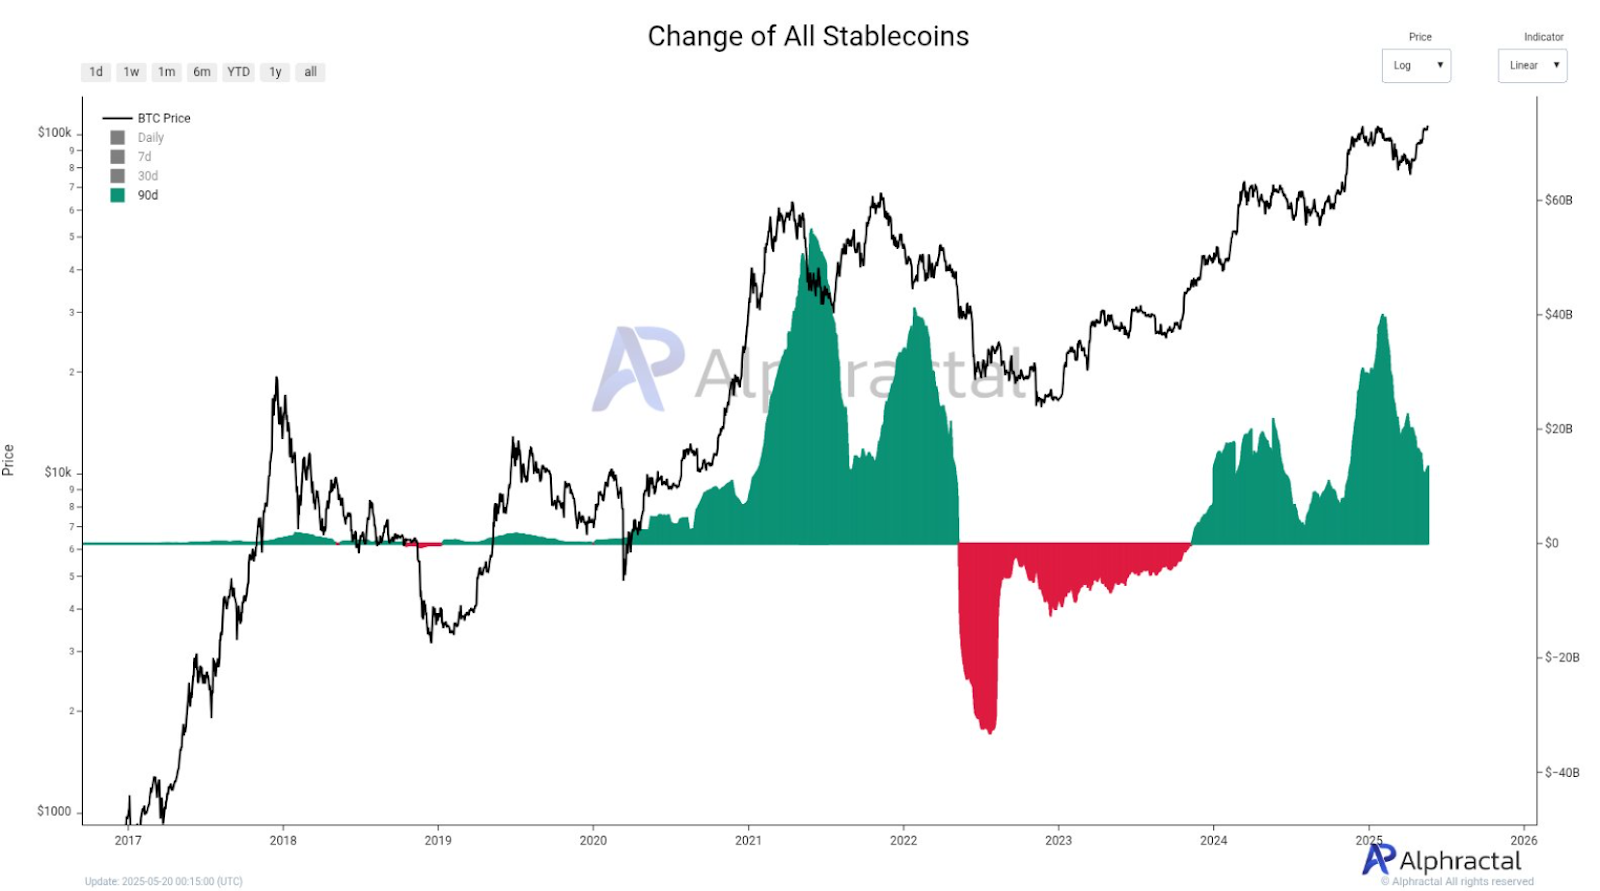
Alphractal’s chart reveals that the overall stablecoin supply is still high, but the 90-day trend turned downward around early 2023, falling nearly $20 billion to its lowest. In 2024, the inflow reached over $50 billion, but the rate has slowed down since then.
Because of this slowdown, the amount of new funds coming into crypto via stablecoins is decreasing. Since many people use stablecoins to purchase Bitcoin and altcoins, less money flowing into stablecoins typically means there is less demand.
When the 90-day curve begins to increase again, this could point to new investment and increased interest in crypto assets, mostly altcoins.
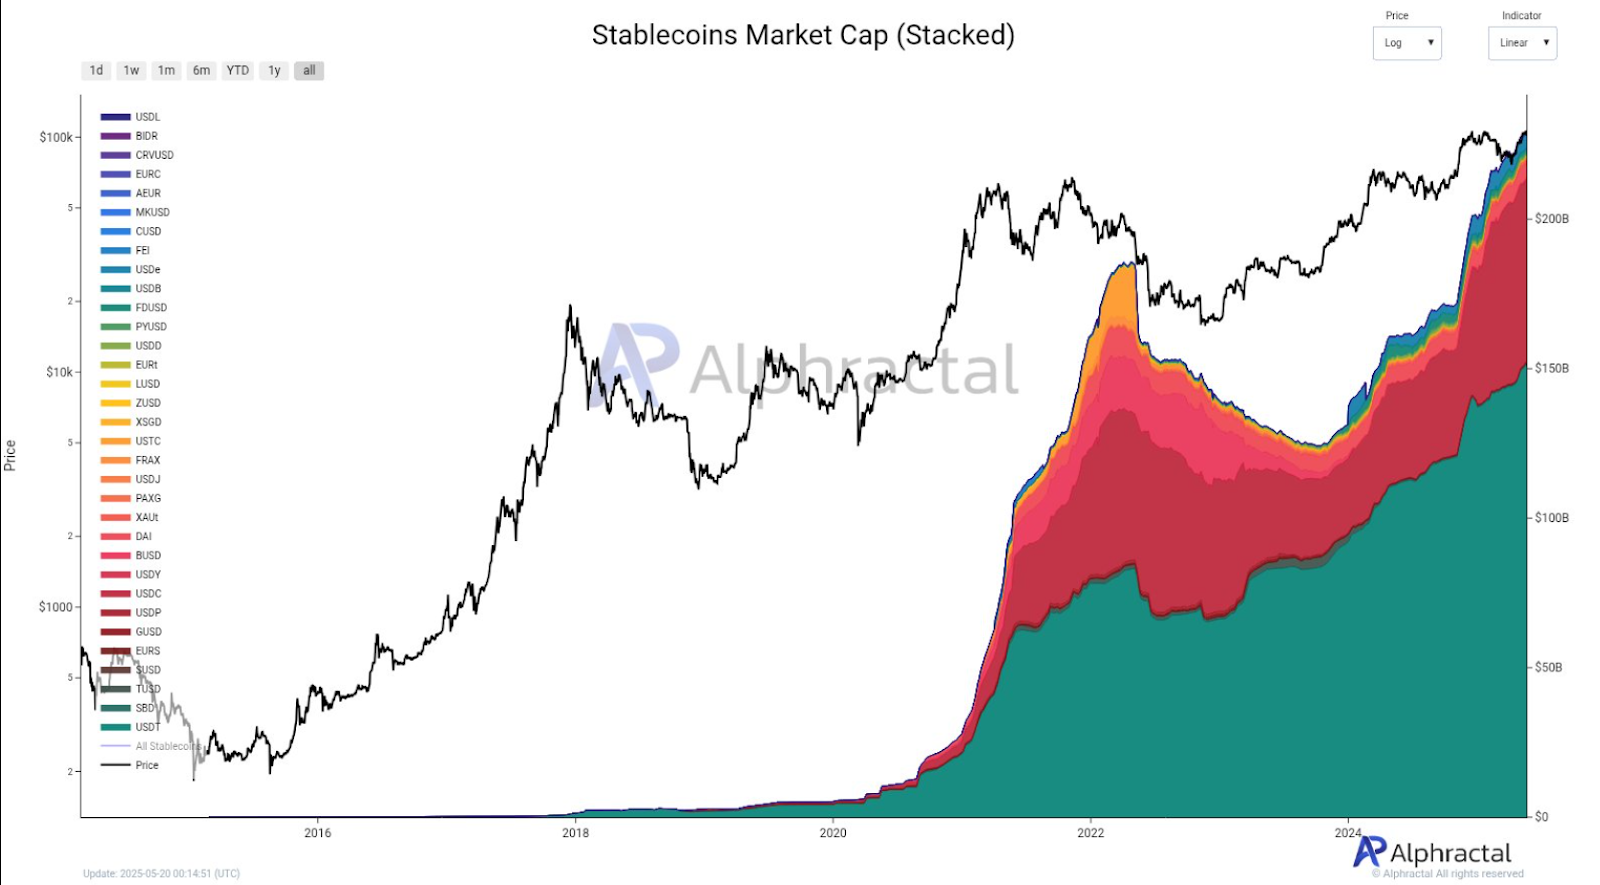
Most stablecoins in the market are still controlled by USDT and USDC. According to Alphractal’s chart, most of the $231 billion market cap is held by these two stablecoins.
Having stablecoins allows traders to feel safe keeping their money before moving it to different assets. But if altcoins stop growing, the market may lack the liquidity needed to start strong rallies.
Altcoin Market Structure Remains Intact but Cautious
According to el_crypto_prof, the altcoin market cap (TOTAL2) is still moving along a long-term pattern. Between 2015 and 2017, 2018 and 2021, and now 2022 to 2025, the market has made higher lows. The structure points to demand that continues, but at a slower speed.
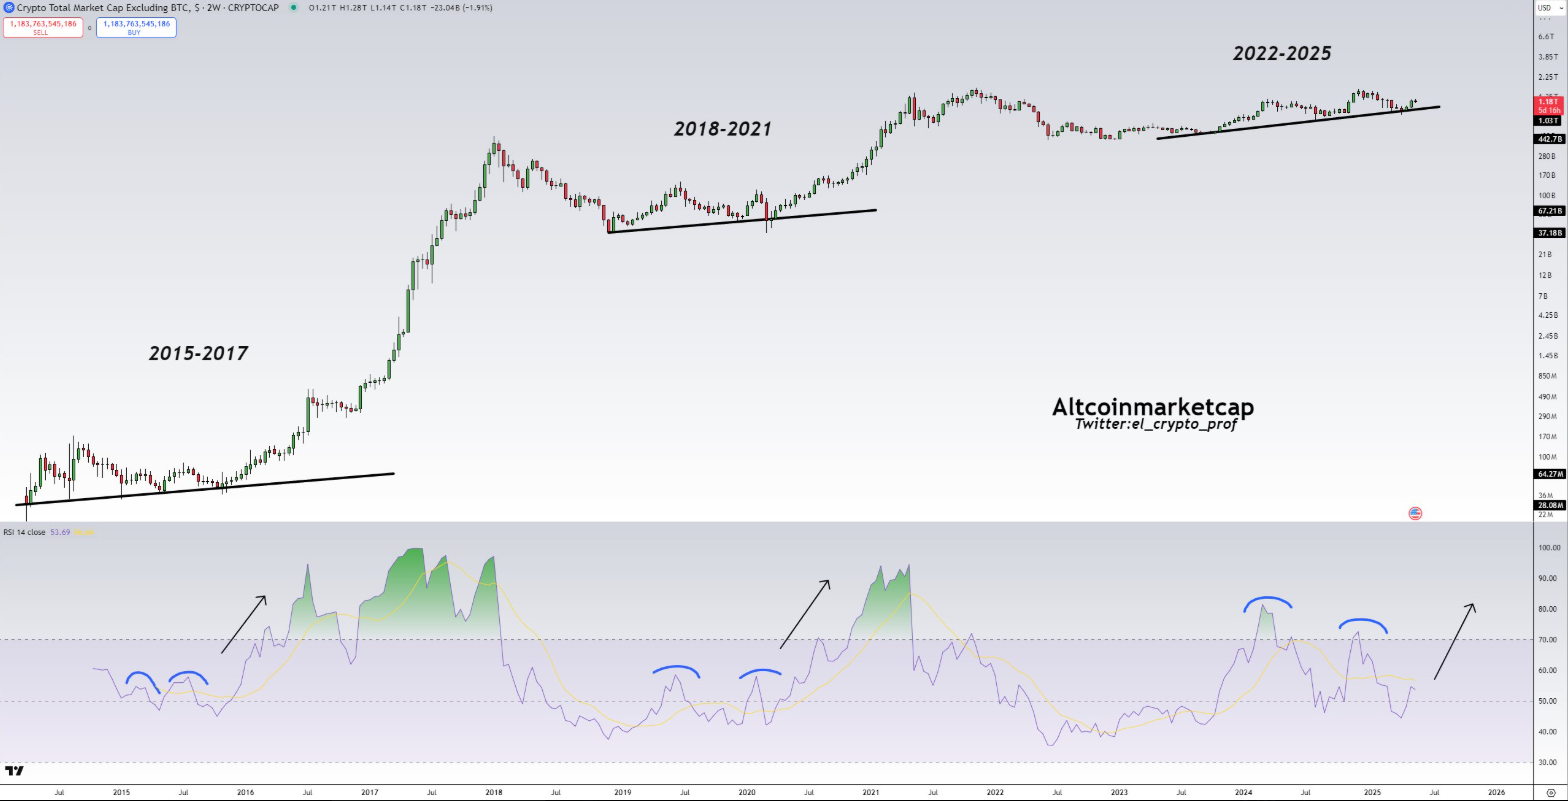
The chart shows the altcoin market has been going up for nearly three years. The market has kept a strong support at around $500 billion.
Unlike before, the Relative Strength Index (RSI) indicates a more even trend, mainly from 2024 to 2025.
Previously, the RSI went above 70, which showed that buyers were in control. Now, the RSI has reached 53, suggesting that there is neither bullish nor bearish sentiment.
Furthermore, according to Alpha Extract, global liquidity has risen steadily every week since the start of 2023. The total value of the world’s stock markets reached nearly $145 trillion by mid-2025, close to the level it had in 2021.
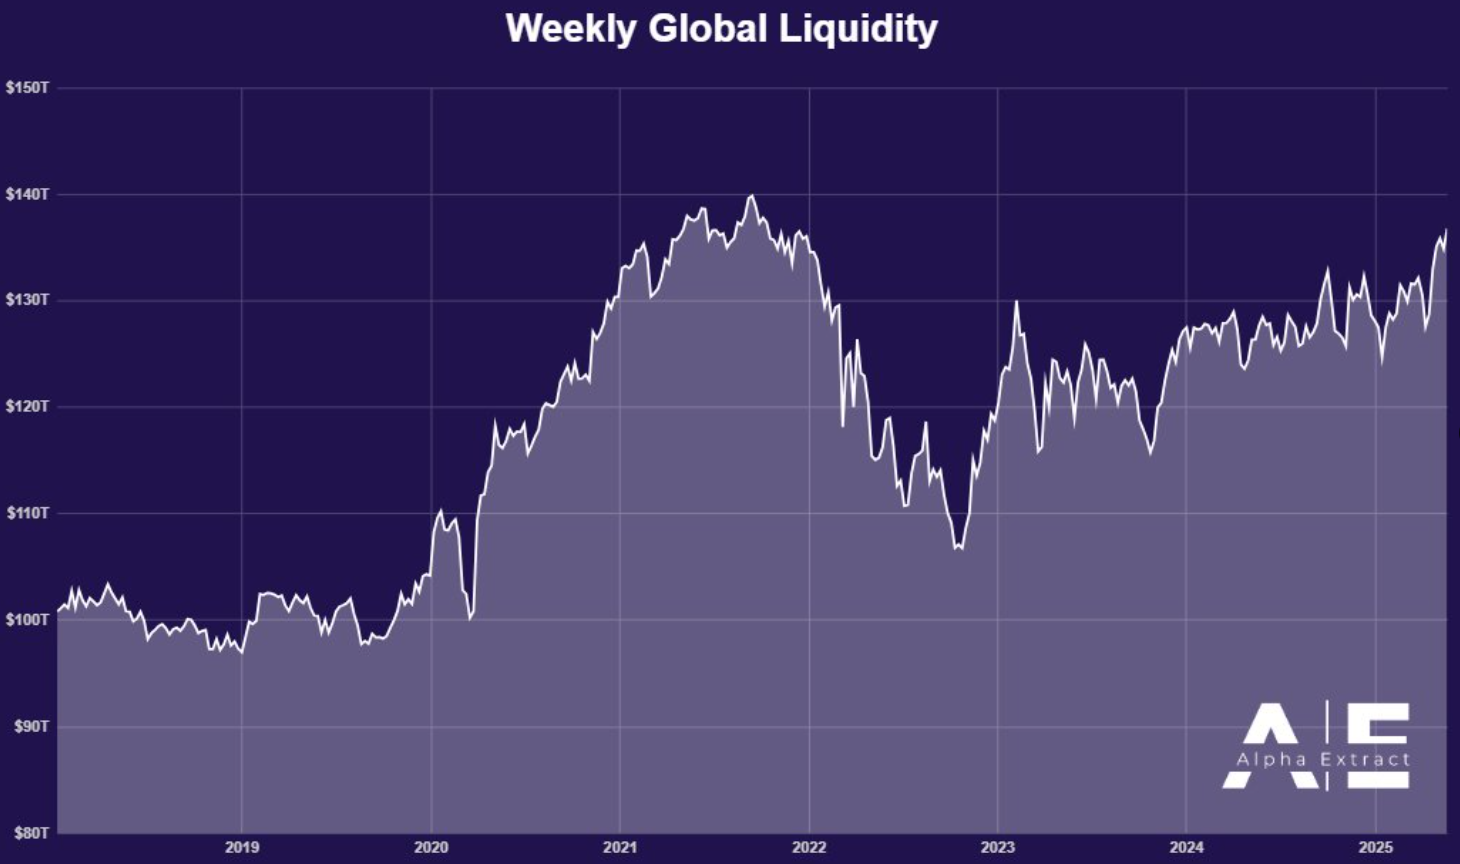
When global liquidity increases, the system has more funds. This is good for Bitcoin and other altcoins. The three-month rate of change (RoC) is positive, indicating that money keeps flowing into the country.
The white line in the rate of change chart remained above zero during 2024 and into 2025, indicating that support continued.
Last week, Alpha Extract noted that global liquidity rose by $1.923 trillion. This means there was a 1.43% increase from the previous week.
The red line which represents the 12-month RoC, is approaching 0% after being negative for all of 2022. A recovery in the market can often show that crypto prices will rise.
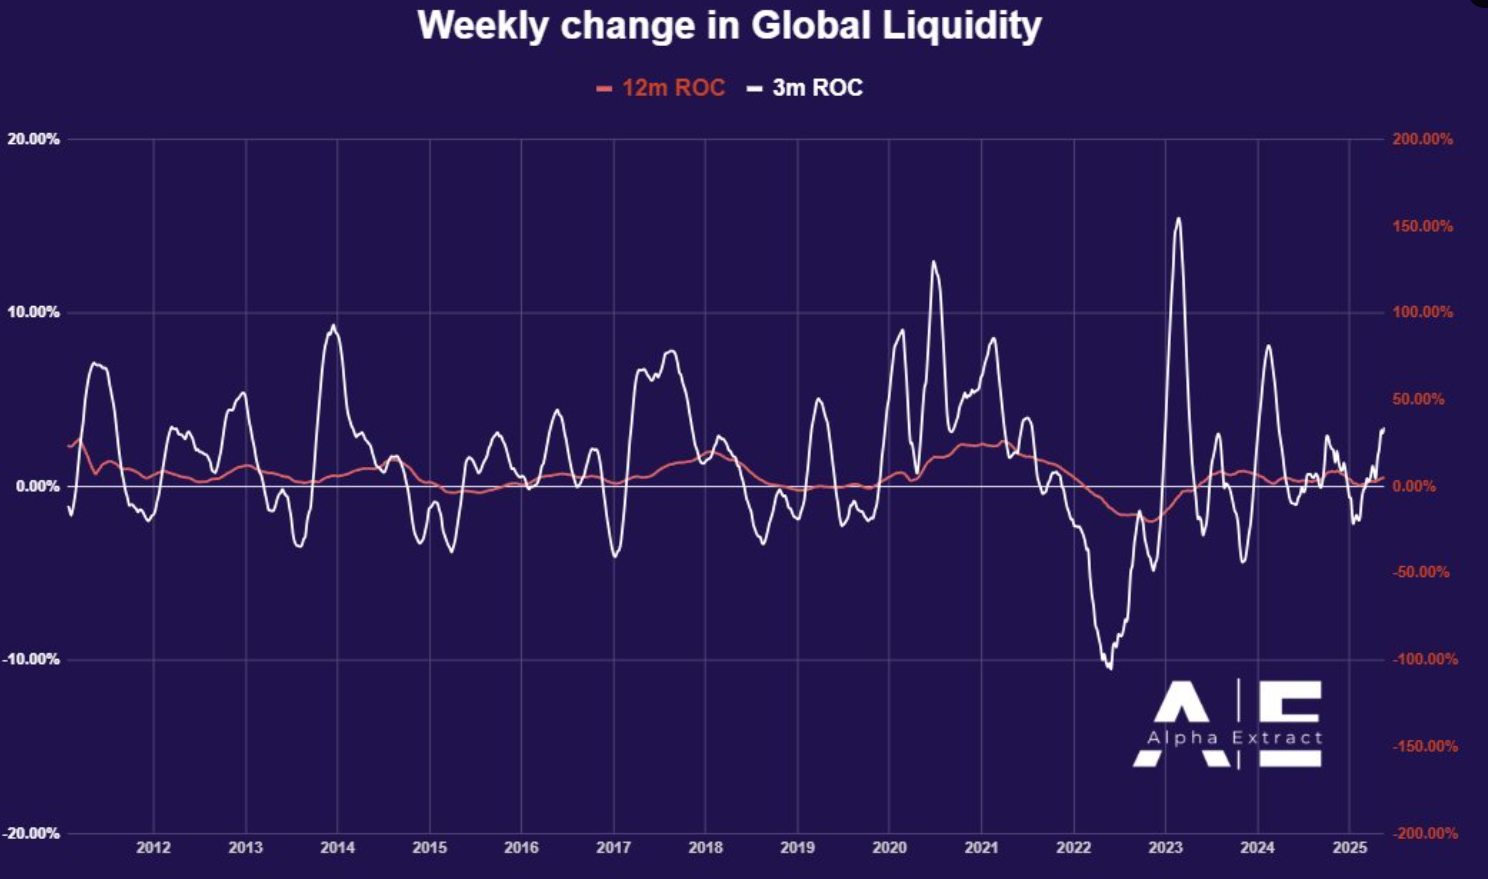
Report pointed out that even though the Federal Reserve has not acted, markets are responding to shifts in liquidity.
The reason this is important is that crypto often does well when central banks are not hiking rates, as seems to be happening now.
Bitcoin’s Steady Climb and Healthy Market Signals
Meanwhile, Bitcoin is on the rise without any signs of overheating. The price recently climbed to $106,490, but it fell slightly after that. The chart reveals that since 2023, there have been three main phases with stable price movement.
The funding rate on Binance has been close to zero since late 2024. Therefore, traders are not putting too much money at risk and are not overly optimistic. A rise in funding is usually a sign that the market is reaching a top, but we are not seeing that now.
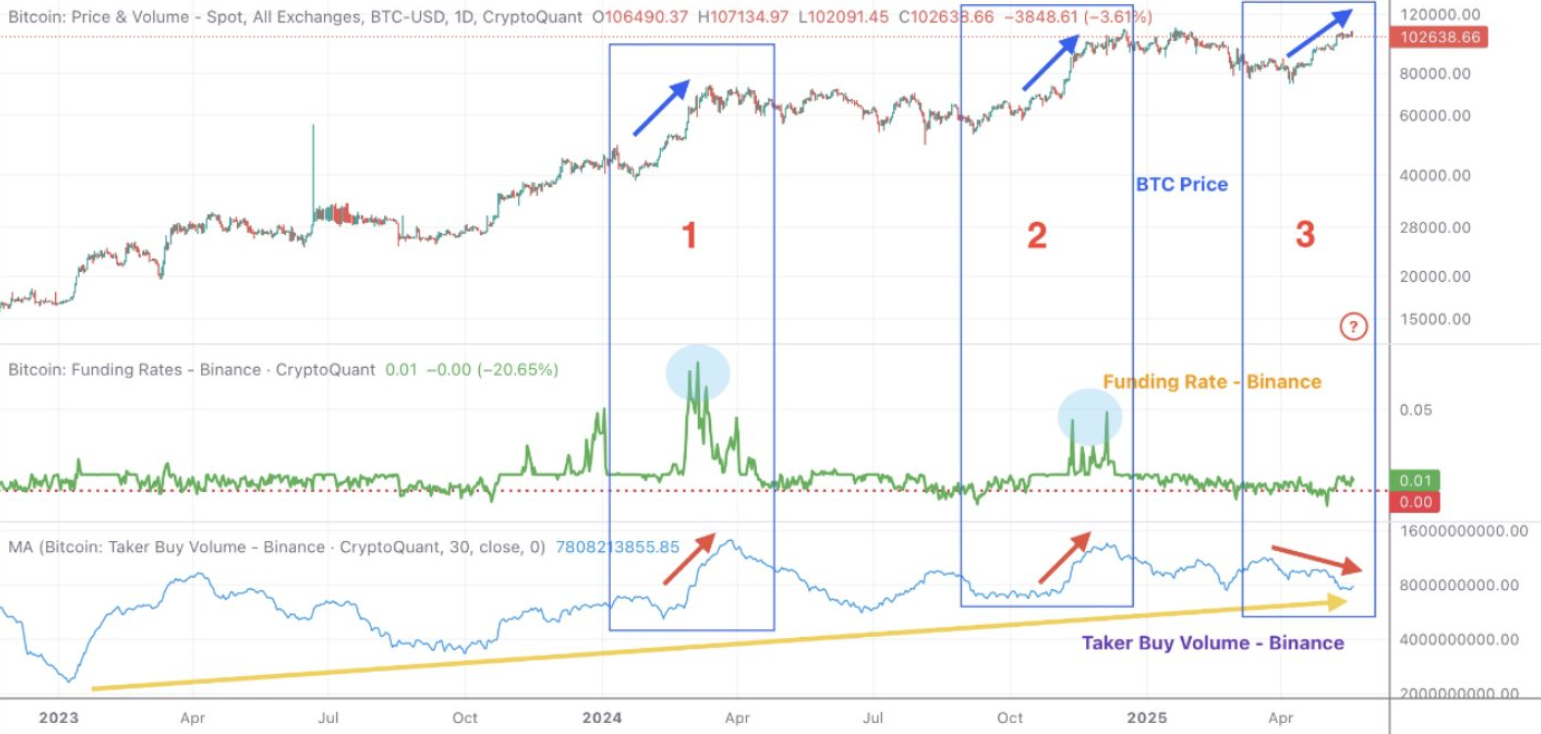
The number of taker buys is stable. The 30-day moving average continues climbing, showing consistent spot demand.
Compared to past cycles, there’s less leverage buildup. This reflects a healthier uptrend driven by steady accumulation, not speculation.
Disclaimer
This article is for informational purposes only and provides no financial, investment, or other advice. The author or any people mentioned in this article are not responsible for any financial loss that may occur from investing in or trading. Please do your research before making any financial decisions.