Celestia
 Pearl
Pearl Quantus
 Zcash
Zcash Hyperliquid
 Injective
 NEAR Protocol

Key insights:
- The Solana price stalls near resistance, facing rejection at the $175 zone.
- Solana funding rate drops, signaling increased short-side market pressure.
- Bearish momentum builds as technical indicators enter oversold territory.
Solana (SOL) showed short-term weakness, dropping 1.33% in the last 24 hours to $174.01. At the time of writing, it traded slightly lower at $173.58, marking a 0.71% daily decline. Market capitalization fell 0.69% to $90.35 billion, while 24-hour volume rose 1.04% to $3.67 billion.
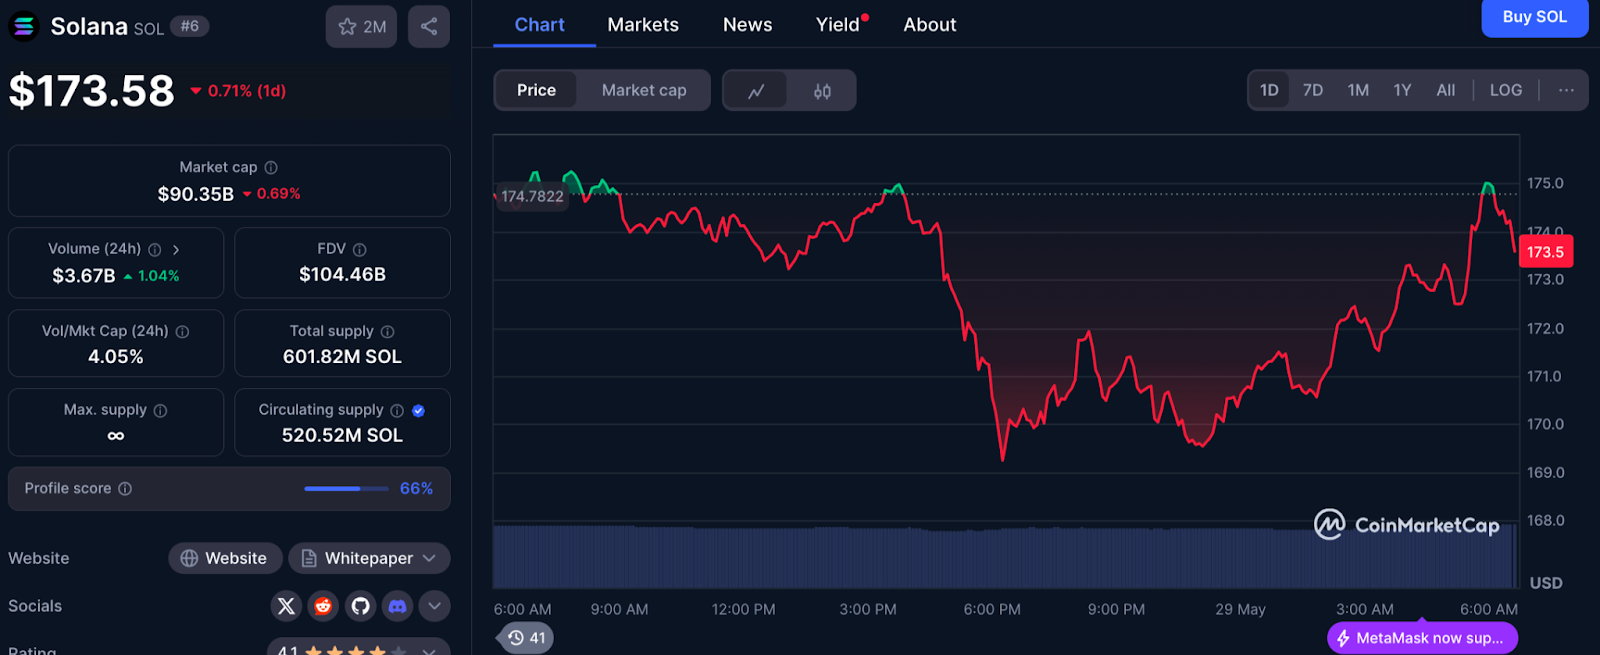
Despite the volume uptick, SOL volatility remained low. The Volatility-to-Market Cap (Vol/Mkt Cap) ratio stood at 4.05%. Swap volume rising alongside price softness suggested that traders were reallocating or adjusting positions.
Solana Ranks 6th Lowest in Funding Rate Across Top Tokens
Bearish sentiment around Solana increased in derivatives markets. After recently testing $188, SOL now ranked sixth lowest among top assets in terms of funding rates. As of May 28, its funding rate dropped to -0.00036%, the lowest level in months, indicating traders were paying to maintain short positions.
The decline aligned with broader negative trends seen across BNB, ADA, and Bitcoin, where funding also turned negative. A negative funding rate reflects more open short positions than longs and typically signals bearish positioning or hedge activity.
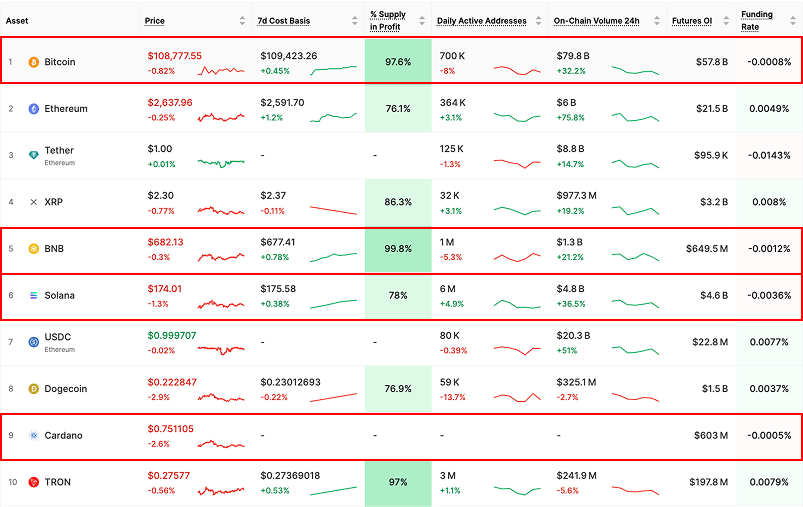
Such setups are prone to sudden reversals, especially if short positions are rapidly unwound. However, in Solana’s case, the buildup coincided with a consolidating market structure observed over the last two weeks.
Solana Price Faces Resistance as Technical Setup Stalls
SOL struggled to break above the $185 resistance, a level aligned with past supply zones. The $180–$200 band, which marked a key rejection earlier this year, continued to limit upward movement. The previous rally off $95–$110 support reclaimed the $170 zone, but prices again hit resistance around $175.
Solana price remained in a narrow $170–$175 trading range, showing no breakout momentum. In the last 24 hours, the price fell from a high of $175.29 to $173.47, reinforcing the view that SOL was consolidating post-April rally.
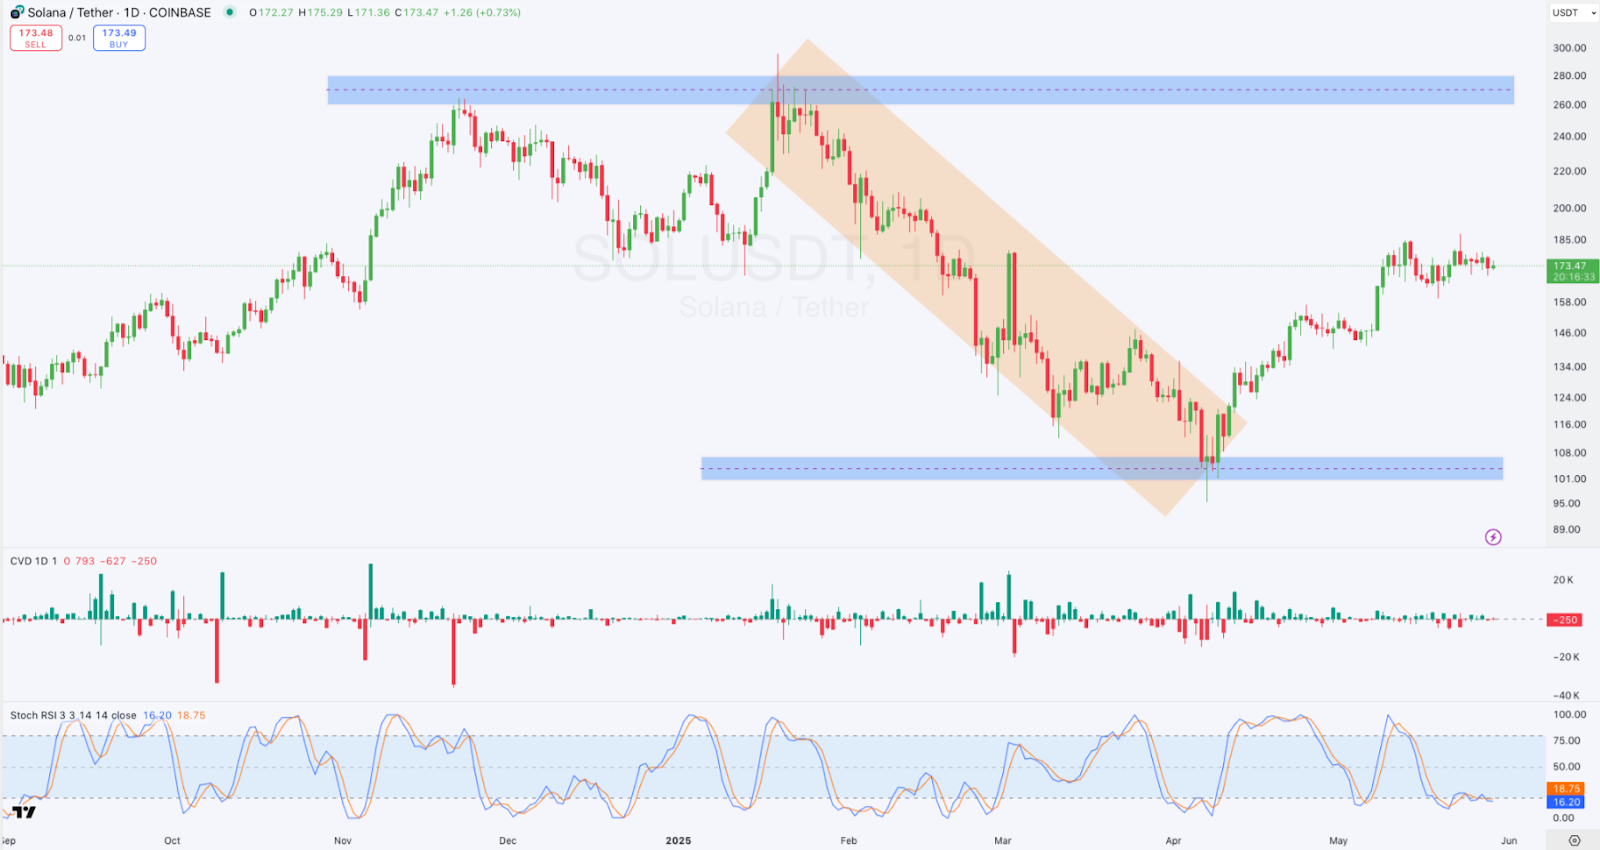
Momentum indicators entered oversold territory. The Stochastic RSI read 16.20 (blue line) and 18.75 (orange), suggesting a pullback exhaustion. The Cumulative Volume Delta (CVD) histogram showed net negative delta at -250, highlighting strong intraday selling.
Address and volume trends showed muted optimism. Solana’s 1 million daily active addresses rose 4.9%, lagging Ethereum’s 7.5% and trailing Bitcoin’s 8% decline. On-chain volume jumped 36.5% to $4.8 billion, which may reflect hedging, liquidations, or repositioning.
Open interest in Solana futures stood at $4.6 billion, trailing Bitcoin ($57.8 billion) and Ethereum ($21.5 billion). In this thinner market, negative funding and shifting sentiment could drive exaggerated volatility. Still, some analysts forecast a potential return to $200.
Disclaimer
This article is for informational purposes only and does not provide any financial, investment, or other advice. The author or any people mentioned in this article are not responsible for any financial loss that may occur from investing in or trading. Please do your research before making any financial decisions.