
 Sword Inu
 no crying in the casino
 streamoors
 IGNITION
 Altai the Tiger
 Pearl
Pearl Quantus

Key Insights:
- Polkadot price breaks wedge resistance, signaling strong bullish breakout momentum.
- Volume surge confirms breakout, indicating rising trader confidence and demand.
- Next resistance at $4.30 could spark a potential 2x rally.
Polkadot price has seen a significant breakout over the past week, forming a bullish trend on the charts. The token is traded above the $4.00 support level, hinting at further upside potential.
Technical charts indicate that the DOT price has fallen from a wedge pattern. It’s a bullish broken pattern in market technical study. Trading volume has surged by over 70% in the last 24 hours. This boost, reaching $362.42 Million, helped fuel the breakout.
If the bullish momentum of Polkadot price continues, investors anticipate a rally. The target is a potential move up to the $5.00 level. The outburst aligns with the widened positive mood in the cryptocurrency market in recent trading days.
The topmost digital coins, such as Bitcoin (BTC), Ethereum (ETH), and XRP, have also recorded positive price movements. This group rally has increased optimism and enhanced market-wide bullish sentiment.
Polkadot Price Breakout Signals Potential 2x Surge
Polkadot’s bullish structure and the associated breakout pattern mean that the asset has a chance to continue growing soon. DOT price has already broken out of a bearish falling wedge structure.
This has provoked a lot of confidence in crypto analysts and traders. According to technical indicators, Polkadot price has experienced a breakout fueled by robust bullish volume.
Analyst patterns show that DOT has exited the long-term descending wedge. It is historically known for preceding upward momentum. Analysts now anticipate that this breakout could lead to a significant bullish run.
If the current trend holds, the DOT price may soon witness a 2x price surge. Buyer interest is also rising, and confirmatory evidence of this, through the volume indicators, also reflects renewed confidence among buyers.
The sentiment is also added by traders anticipating a falling wedge breakout as a good reversal strategy.
Crypto market observers continue monitoring the DOT/USDT pair and expect further developments. The Polkadot ecosystem remains one of the most followed in the Web3 and DeFi space.
This upward movement may signify the start of a broader rally for the Polkadot price, provided market conditions remain favorable. Crypto Mullah, another analyst of cryptocurrencies, noticed a big breakout in Polkadot on the daily chart.
His analysis states the cryptocurrency has passed the upper resistance trend in a falling wedge formation. This technical pattern is usually regarded as a bullish signal indicating a possible reversal of a long-term downtrend.
A price action supports the breakout, which suggests an upward pressure in the short term. The falling wedge has been established over several months, showing a long consolidation period. Such a breakout usually attracts the attention of traders searching for a position on a trend change.
DOT Price Held Firm Above $4 as Bulls Target $5 Resistance
Polkadoto price showed steady performance, as prices closed slightly above the $4.00 level. The cryptocurrency climbed 4% daily, registering a close at $4.001.
The technical indicators indicated the presence of positive momentum. The Relative Strength Index (RSI) approached 63.24, moving it to a bullish territory but not to overbought territory.
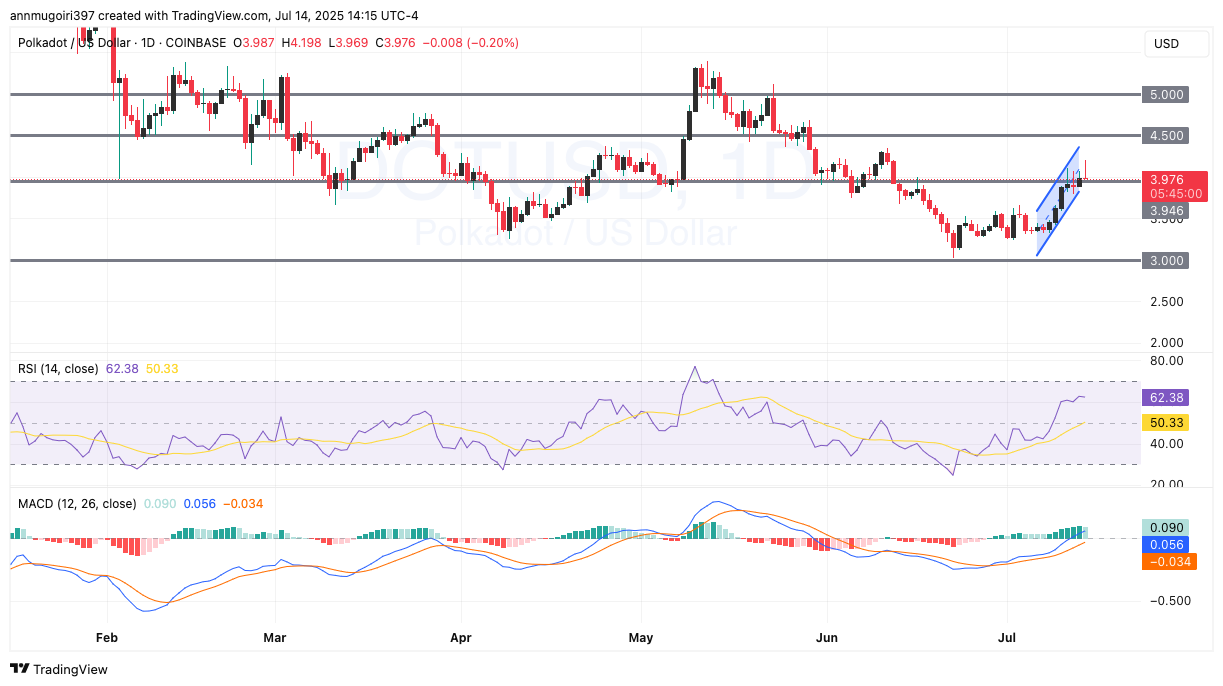
Moving Average Convergence Divergence (MACD) indicator also held a bullish position. The MACD line was above the signal line. This means there was a reading of 0.092 compared to the signal reading of 0.058. Positive histogram bars added strength to the bullish outlook.
Immediate resistance was identified at $4.50. If DOT breached this barrier, the next upside target was $5.00. However, failure to maintain current levels might push prices back to the $3.95 support. Also, a further breakdown could retest the $3.60 or $3.00 support zones.
Disclaimer
This article is for informational purposes only and provides no financial, investment, or other advice. The author or any people mentioned in this article are not responsible for any financial loss that may occur from investing in or trading. Please do your research before making any financial decisions.




