
 streamoors
 IGNITION
 Injective
 Quantus
 NEAR Protocol
 Pearl
Pearl LayerZero

Key Insights:
- Litecoin price is tracking Ethereum’s breakout, with $140 as the key resistance level.
- Analysts pointed out bullish patterns, one of them being a falling wedge, which indicated a short-term rally.
- If LTC price breaks past the $140 level, then it might present possibilities of $170, $190, and $220.
Litecoin price action has attracted attention after breaking key resistance levels, with analysts pointing to potential sharp gains. Several technical patterns are showing a continued bullish trend. Furthermore, a comparison with Ethereum’s recent breakout showed that targets are much higher. With its momentum, analysts are projecting the potential of the LTC price rallying toward $220.
Litecoin Price Breakout Mirrors Ethereum’s Rally
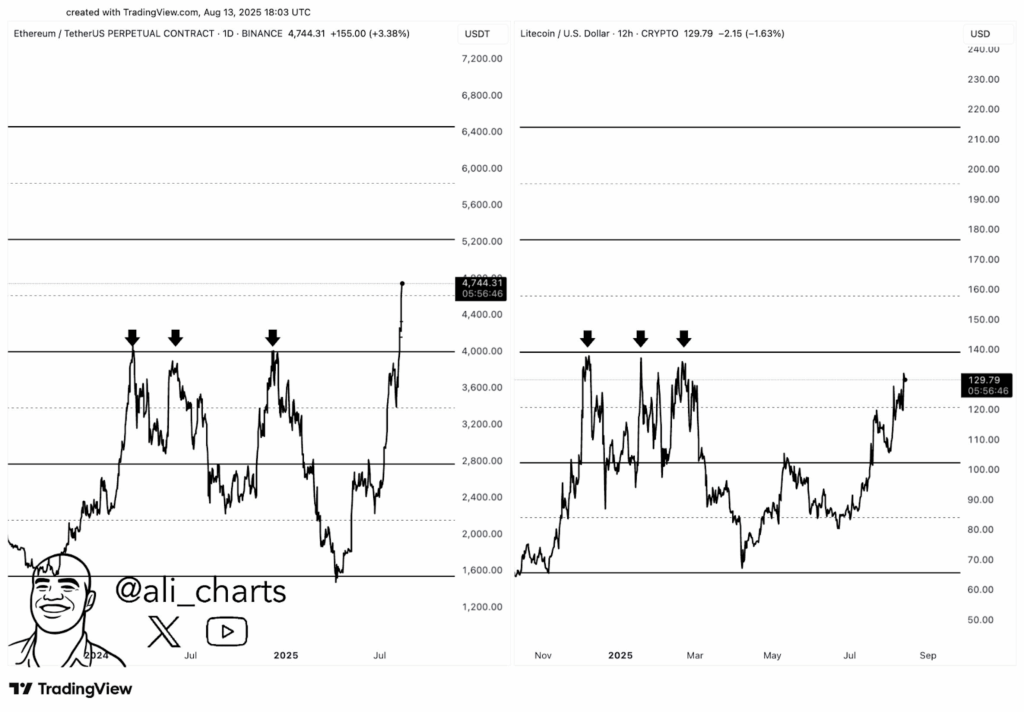
The recent market data showed that Litecoin‘s chart construction closely followed Ethereum prices. Analyst Ali highlighted a symmetrical resistance pattern on both assets, with the ETH breakout above $4,000 mirrored by the Litecoin price approaching $140. This relationship indicated that if the breakout worked out, LTC price might trace the Ethereum path to $220.
The LTC/USDT chart showed multiple rejections at the $140 level earlier in the year. The August price action has broken out of a mid-term consolidation zone between $110-$126. Notably, a clean breakout above $140 would open the next target at $170.
Litecoin Key Support and Resistance Levels
Furthermore, CRYPTOWZRD noted that the Litecoin price closed the daily candle bearish, following Bitcoin’s corrective move. However, LTCBTC held above a previous resistance that flipped to support, an important bullish technical sign. The main daily support was $112, while $140 remained the immediate upside resistance.
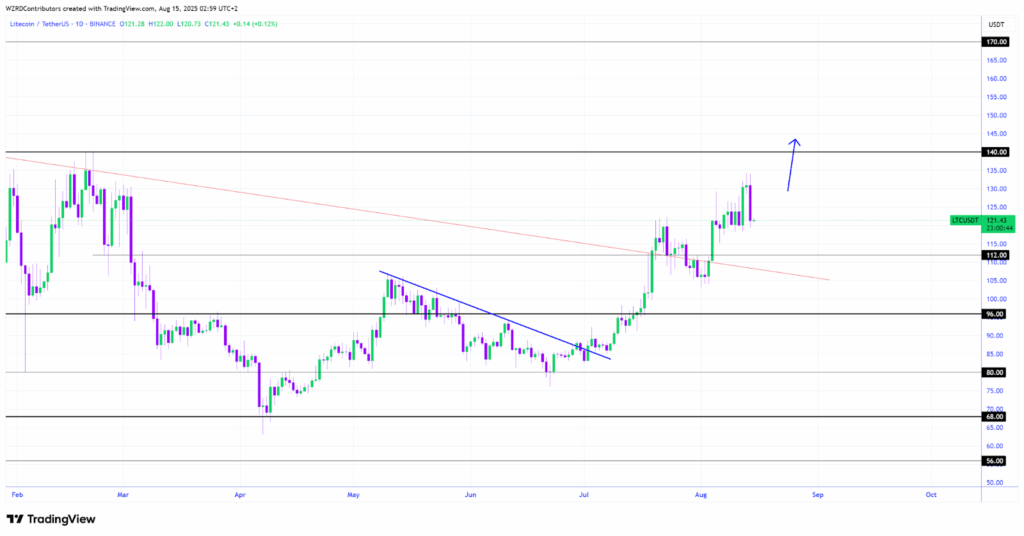
Intraday volatility increased after a Bitcoin-led liquidation cascade, which briefly tested the $126 resistance. A breakout above this level targeted $134, aligning with Fibonacci extensions from the past swing low. Failure to sustain $126 might return the price to $112 before the next uptrend attempt.
Market structure suggested that sideways consolidation near resistance was possible before a breakout. Liquidity at around the $134 level determines whether momentum can be built up to $170 in the medium term.
Short-Term Chart Patterns Signal Bullish Targets
More so, Crypto Joe identified a falling wedge on Litecoin 30-minute chart, a pattern known for bullish breakouts. The wedge measured move target was at $134.35.
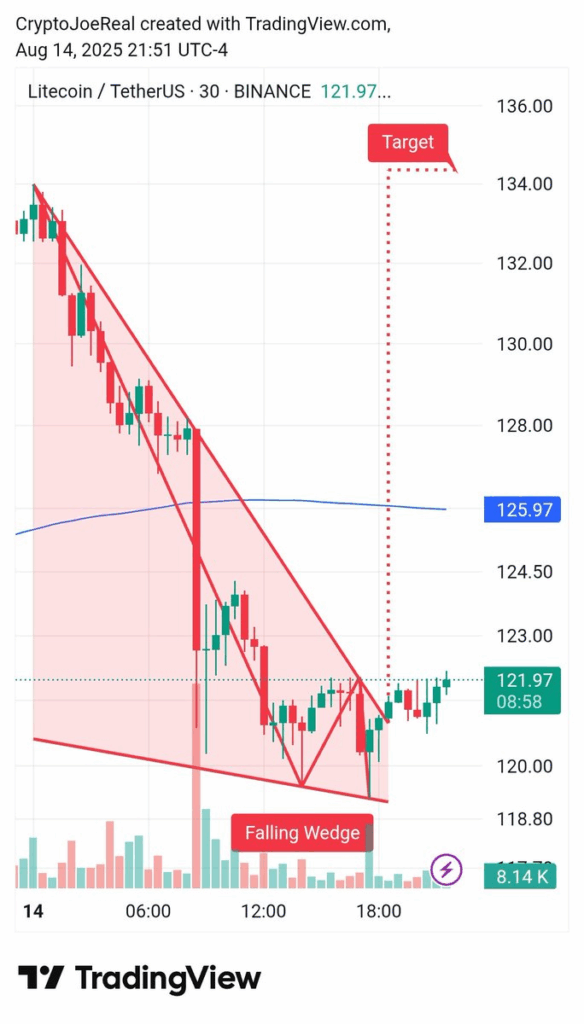
The wedge breakout came after the top altcoin price rebounded near $121. The alignment of microstructure targets with higher timeframe resistance reinforced the potential for a multi-phase rally.
Long-Term Projection for Litecoin Price
Meanwhile, the monthly chart analysis showed that the Litecoin price has actually seen a breakout of its long-term descending line, similar to the ones that started unfolding back in 2017 and 2021. In the 2017 cycle, LTC price broke out over 8,400 percent above the breakout point, and in 2021, it increased over 580 percent.
The present arrangement indicated a possible upside of $818 in case the 2021 percentage increase occurred again, and as much as $10.354 in case the 2017 performance was echoed.
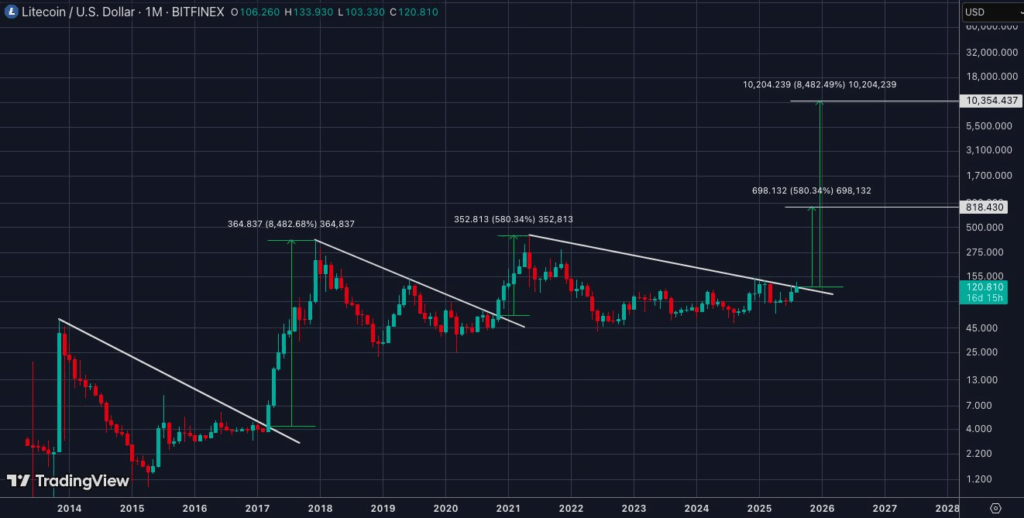
The breakout zone was formed due to repeated trendline resistance retests since 2022 with continued bullish pressure. Surf highlighted that the move could be somewhere between the rally of 2017 and the moderate gains of 2021.
The critical key level to monitor is at $140, where a convincing break would confirm the start of a long-term expansion cycle.
However, Kapoor Kshitiz pointed out that Litecoin price had to defend its existing range or fall to the next significant support at $105. LTC price had tried this level several times in July and rallied. A breakdown could trigger a stop and cause further losses at $96, a lower support.
Notably, at press time, LTC price traded around $121, consolidating after a multi-week rally from $96. Analysts said staying beyond $112 was crucial to maintaining upward momentum through September.
Disclaimer
This article is for informational purposes only and provides no financial, investment, or other advice. The author or any people mentioned in this article are not responsible for any financial loss that may occur from investing in or trading. Please do your research before making any financial decisions



