
 Sword Inu
 no crying in the casino
 streamoors
 IGNITION
 Altai the Tiger
 Pearl
Pearl Quantus

Key Insights:
- Sei transactions surged 37.4%, reaching 5.5 million daily activity.
- $SEI price consolidates, forming a symmetrical triangle near $0.32.
- Accumulation zone at $0.29 supports potential 40% bullish breakout.
The Sei Network has reported an increased daily activity with transactions rising by as much as 37.4% in the recent past, to 5.5 million. This is one of the highest levels since the beginning of the month, when transactivity temporarily exceeded six million transactions. Such stability in the volumes indicates a strong site activity throughout the network.
Growth in transactions is widely perceived to be one of the important barometers of network health. In the case of Sei, this rise in activity is accompanied by some technical signals on the price chart, which indicate the possibility of a resolute move.
Symmetrical Triangle Signals Breakout Potential
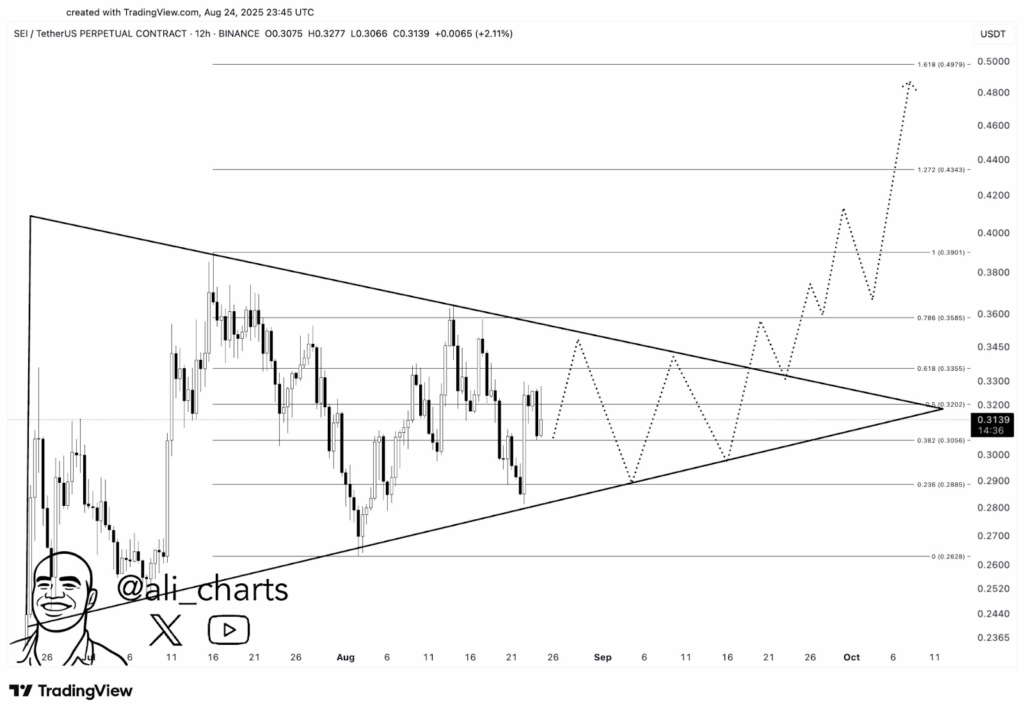
SEI price movement indicate the formation of a symmetrical triangle on the twelve-hour chart as the company has consolidated. The price has been flashing between support at the level of $0.30 and the resistance at the level of $0.32 constantly decreasing into the apex of the triangle.
These types of formations are usually interpreted as anticipating future volatility, followed by breakout often after long periods of consolidation.
Ali Martinez has hinted that the Sei price could jump by 40% should the pattern resolve higher. Fibonacci extension levels support this projection and possible targets include $0.39, $0.43 and $0.49. SEI is currently at $0.3139, almost 2% up since the previous trade.
The potential breakout above the prevailing $0.32 price level would make sense of the technical factors when it comes to increased price targets.
On the short-term chart, SEI remains in the ascendancy zone of build-up between 0.288 and 0.296. The market has strongly held its own in this region as buyers have successfully defended several times in the month of August. Both of the dips into this zone have experienced new interest, which makes this zone so significant as a source of near-term support.
Even hourly price activity indicates that SEI is trading within a bearish channel The downward channels will have accumulations zones with strategic buyers who would be awaiting the reversals.
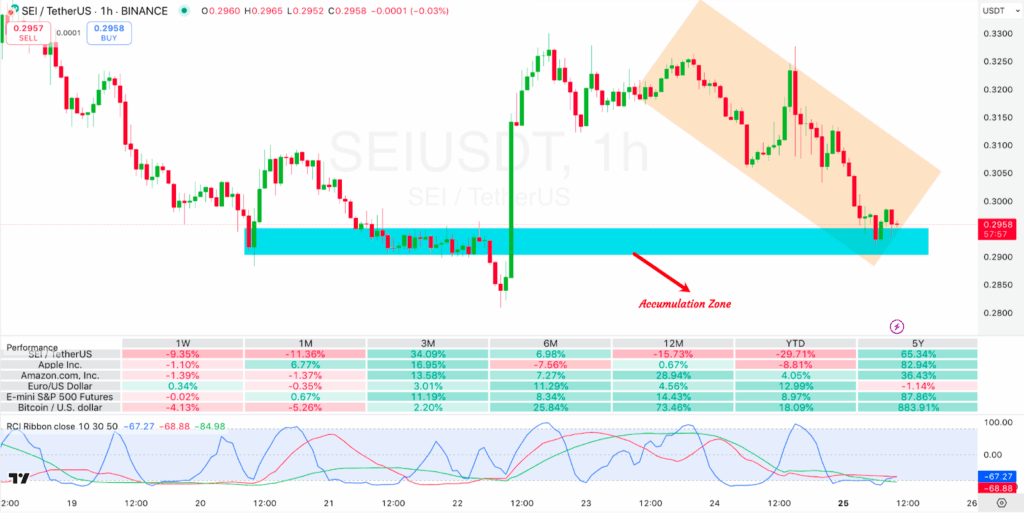
An exit beyond the channel, especially a breakout around the symmetrical triangle, may change the trend and establish a higher trade interval.
Sei Market Comparison
The Sei price has mirrored even the general market situation. That took the token lower by 9.35% over the last week, and down 11.36% over the month. In a three months scale, SEI has recorded an increase of over 34%. Which is an indication that it is not prone to short-term corrections.
On a year-to-date basis, the token is still down by a marginal rate of nearly 30%. Though it continues to demonstrate a five-year growth rate of more than 65%.
Comparisons with the big benchmarks would indicate the similar pressure across markets. Bitcoin is down 4.13% in the past week and Big Cap Stocks. Like Apple and Amazon recorded a drop of over one percent. Despite such conditions, SEI has made significant gains over the past three months. This, in turn, suggests that there is still accumulation. And an interest in the project when other risk assets are consolidating.
The momentum indicators have as well shown a market at an inflection point. On the hourly chart, the RCI ribbon indicates that the stock is deeply oversold. This is typically the first sign of revival. Together with the power of the aggregate area, such readings will enhance the significance of the current support points.
The short-term outlook of the traders is the resistance level of 0.32$. A rally of prolonged duration beyond this price level would invalidate the symmetrical triangle. And open the door to a more spirited rally.
Disclaimer
This article is for informational purposes only and provides no financial, investment, or other advice. The author or any people mentioned in this article are not responsible for any financial loss. That may occur from investing in or trading. Please do your research before making any financial decisions.



