
 Pearl
Pearl Zylo Ecosystem
 Sui
Sui Starknet
 Pons
Pons NEAR Protocol
 Quantus

XRP market momentum is building as analysts highlight strong technical setups. These signals suggest the next expansion phase could soon lift the XRP price.
XRP crypto stabilized above $2.30. This aligns with historical patterns observed before previous rallies. Analysts highlight bullish structures, long-term projections between $8 and $27.
XRP Price Eyes $8-$27 Range as Wave 4 Approaches End
EGRAG Crypto believes that the XRP price is nearing the end of Wave 4. It is poised for an intense Wave 5 recovery. He based his analysis on the Elliott Wave Theory. Data from the EMA Ribbon support this on the monthly charts.
According to EGRAG, corrections of Wave 4 often mislead traders into selling too early. Historically, such pullbacks have preceded significant rallies, especially in the case of assets like Bitcoin during its 2017 cycle.
Wave 4 usually retraces 23% to 38% of Wave 3. In some cases, the retracement can be deeper. It may extend to around 50% during larger cycles.
The analyst projected a completion of Wave 4 at around $1.40, which could mark a possible turnaround point. His model projects the targets of Wave 5 at $7.29 – $8, using the extension of the Fibonacci 1.618 level.
This is consistent with his overall macro outlook, which suggests that the following primary bullish phase is about to begin. EGRAG explained how both retracement phases historically move into renewed bullish pressure after testing the EMA Ribbon.
He emphasized that this repetitive pattern is indicative of strength being built under the surface. This prepares the XRP crypto for the next parabolic advance.
EMA Ribbon Supports Bullish Outlook Towards $20
In a follow-up analysis, EGRAG pointed out the importance of the EMA Ribbon on the monthly timeframe. He went on to explain that XRP price tends to dip into this ribbon before experiencing its final pre-rally accumulation.
EGRAG noted that the top altcoin has followed the same sequence in previous cycles. Before the 2017 and 2021 breakouts, the price touched the EMA Ribbon.
This happened roughly three months before each surge. He stressed that what is happening now is typical of this pattern.
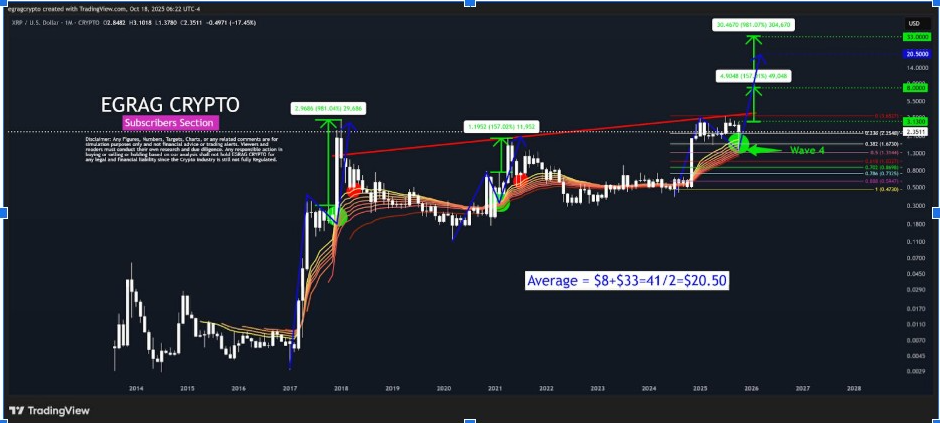
His analysis of the chart puts the three potential upside projections at $8, $20, and $27. These levels are related to previous cycle extensions. The average target, based on historical price behavior, is around $20.50.
EGRAG stated that the next significant bullish wave for the XRP crypto may begin soon. It depends on holding momentum above the green circle on the EMA chart.
He believes that this level represents the “last touch” before a widespread expansion phase occurs throughout the market.
Analyst Sees 2017 Rally Structure Repeating
Steph is Crypto suggested that the current structure of the XRP price is similar to previous rallies in 2017. He shared a weekly chart mirroring a setup that preceded XRP’s historic 13,000% rally that year.
According to his model, the accumulation phase for the XRP crypto is nearing completion. The pattern shows a similar consolidation under resistance, before the explosive breakout of past cycles.
Steph emphasized that this type of cyclical trend often recurs when macroeconomic liquidity is concurrent with favorable market sentiment. He added that current conditions, and especially growing institutional interest, are very similar to those in 2017.
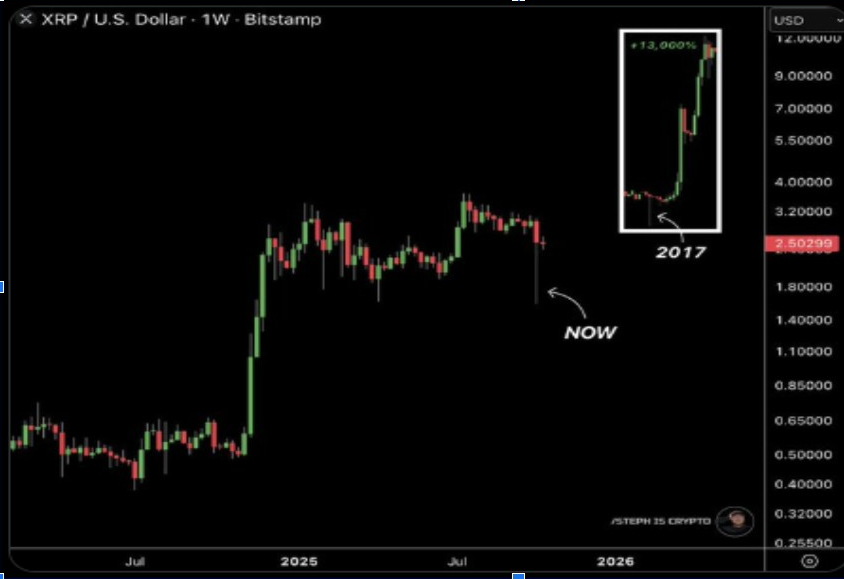
If history repeats, the XRP price could surge after breaking its $3.40 resistance. That move might trigger a sharp upward trajectory.
XRP Price Entering New Phase of Accumulation
To bolster the bullish case, EtherNasyonnal highlighted a key demand zone for the XRP crypto in a long-term consolidation. He compared the current setup to the 2017 cycle. There, the price revisited past resistance before initiating a new parabolic cycle.
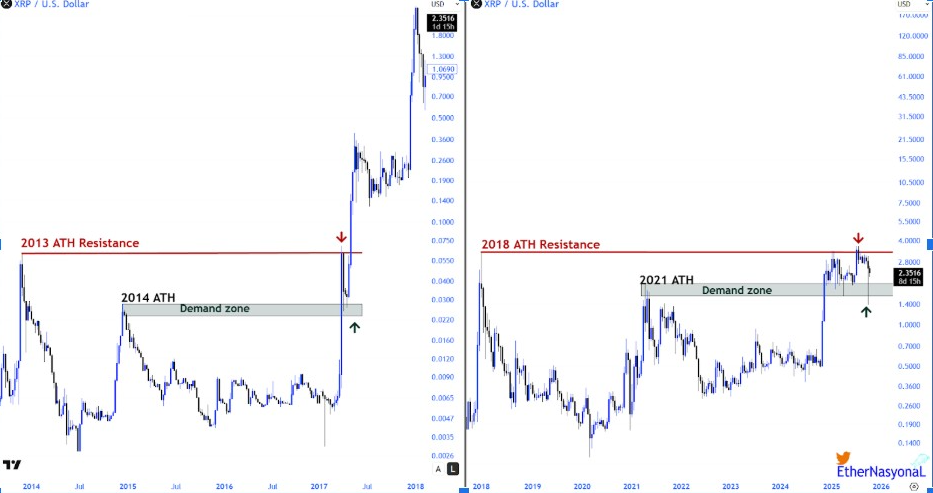
According to his analysis, the XRP price is now retesting the previous all-time high resistance from 2021. This has turned into strong demand support. The structure shows a “same setup, new phase” alignment. This indicates early-stage accumulation from which a major expansion may occur.
EtherNasyonnal’s chart showed that the structure of XRP is proceeding just as it was during the 2014-2017 accumulation period. This sets the groundwork for another parabolic run, likely on the same long-term Elliott map as mentioned by EGRAG Crypto.
He concluded that XRP may need to remain within its current range for longer. This could prepare the ground for a larger macro breakout. If momentum holds, the XRP price could soon transition from accumulation to expansion.




