
 streamoors
 IGNITION
 Sword Inu
 no crying in the casino
 Altai the Tiger
 Pearl
Pearl Pudgy Penguins

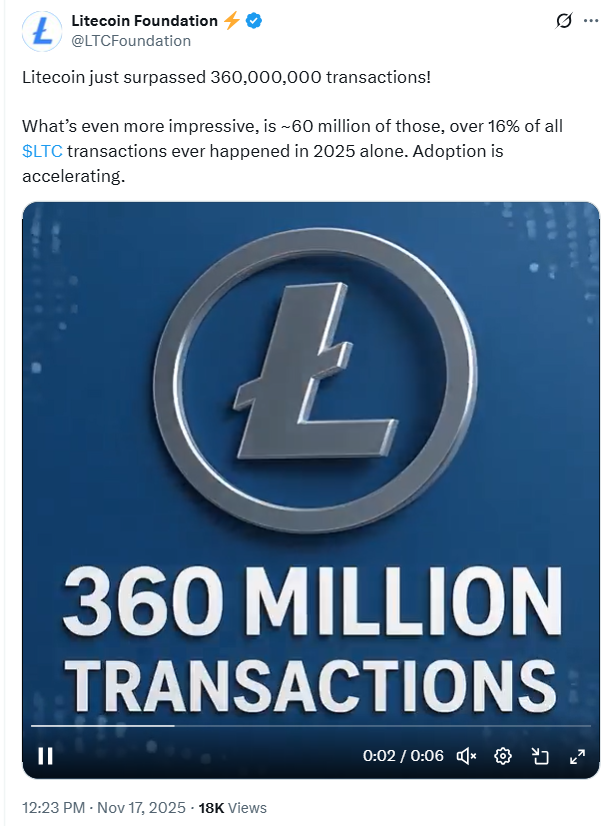
Litecoin has reached 360 million transactions since its inception, with about 60 million recorded this year alone.
The rise in activity has drawn attention to its market position. This also raises questions about the next price direction.
Community discussions compare Litecoin with Bitcoin and examine recent chart patterns that show both support and pressure.
Growing Litecoin Activity Draws Market Attention
The Litecoin Foundation reports that the network has now processed over 360 million transactions. About 60 million of these took place in 2025. This means that over 16% of all Litecoin transactions occur within the current year.
This consistent build in activity shows that the network remains widely used for simple and fast transfers. Comments from market participants note the pace of growth. Luxxfolio Holdings states that Litecoin daily transactions have climbed slowly for years.
The group noted that Bitcoin’s daily activity has slowed during the same period. These remarks do not predict outcomes but highlight the steady pattern seen on Litecoin’s transaction charts.
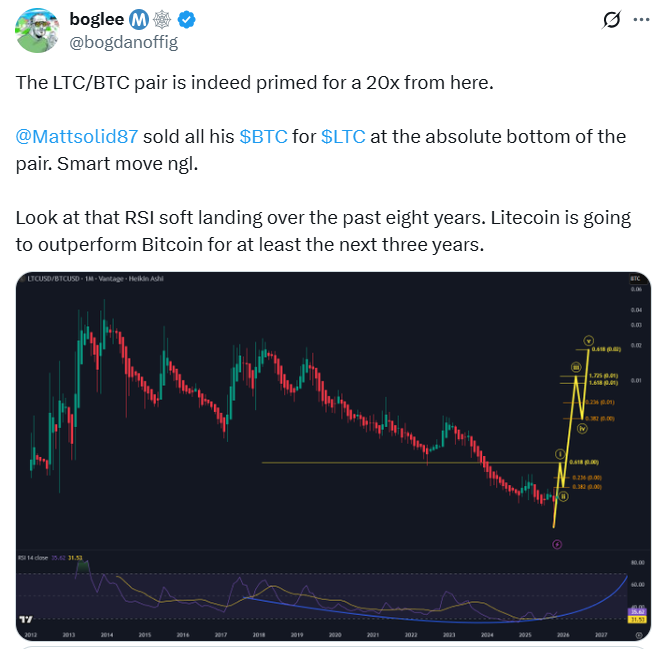
Discussion within the community also reflects different strategies. One user says that all Bitcoin holdings were sold to move fully into Litecoin. That post received attention because it highlighted a very direct shift in preference.
Another market observer noted that the LTC/BTC pair sits near the lower area of its long-term range. The observer referred to an eight-year chart. He mentioned that the Relative Strength Index has eased into what is described as a soft landing.
Notably, these comments are based on chart signals rather than new fundamental changes in the network.
Traders Examine Litecoin’s Position Against Bitcoin
The LTC/BTC comparison becomes a frequent topic among traders. Some market watchers say that the pair could move sharply if long-term patterns hold.
One post claims that Litecoin could show large gains from current levels. These comments come from chart interpretations rather than broad market research. Several users highlight the recent switch to Litecoin. They describe it as happening at the lower point of the pair’s range.
Support built over many years can act as a solid foundation. The reasoning depends on technical signals, with emphasis on repeating trends and RSI readings.
This comparison illustrates how traders utilize long-term historical data to inform their short-term expectations. It does not confirm any outcome, since the pair still reacts to the wider market.
Bitcoin’s movement often influences altcoins, so the pair reflects more than Litecoin’s activity alone. The debate shows the range of views rather than a single direction.
LTC Price Holds Important Support as Technical Signals Shift
Litecoin trades inside a falling wedge on the four-hour chart. The structure suggests that bearish momentum has weakened.
The lower line of the wedge sits in the $94 to $95 area. Additionally, the price has tested this support level multiple times. This zone becomes important for traders watching for signs of strength.
A move higher from that level could send the price toward the upper line near $100. That area also matches the 0.382 Fibonacci retracement level. A break above the line could open a path to $108 and possibly $115. These levels appear as larger pockets of resistance on the chart.
Some analysis points to a different view. Litecoin price trades below the 50-day simple moving average. As of the time of writing, it was trading at $95.24. The price has also broken a short-term ascending trendline, which adds weight to selling pressure.
The RSI shows a fresh negative crossover after recovering from earlier oversold territory. Based on these signs, the coin may move lower if it remains below the $100.60 resistance.



