streamoors
 IGNITION
 no crying in the casino
 Sword Inu
 Altai the Tiger
 NEAR Protocol
 Quantus

The price of Bitcoin fell sharply as traders reacted to new inflation data and rising sell orders.
Peter Brandt said the decline could help the market build a base for a long-term rise toward $200,000 by 2029.
Amid broad speculations on Bitcoin price, John Bollinger also pointed to weak signals on the chart amid fading strength in recent sessions.
Peter Brandt Outlines His Long-Term Outlook
Bitcoin continued to face selling pressure toward the end of 2025. Traders reacted to fresh economic numbers that reduced hopes for a rate cut.
The price moved lower, and daily volume increased for several days. Order books showed strong exit flow during the decline.
Peter Brandt shared his view on the market during the downturn. He said he still held 40% of his largest Bitcoin position.
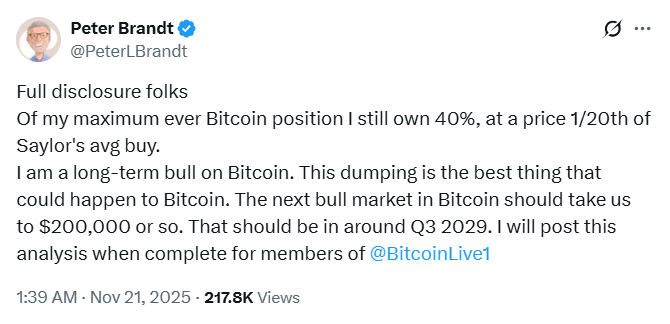
He claimed he bought that position at a price that was one twentieth of Michael Saylor’s average buy. Brandt explained that the current drop could support a longer build-up.
His view suggested that the decline might help Bitcoin price form a stronger base over time.
He estimated that the next major rise could reach about $200,000 in the third quarter of 2029.
Brandt said he would release his full report when he completes his analysis. His remarks drew attention because many traders watched long-term signals during the sell-off.
The legendary trader’s comment about possible pressure on corporate holders also shaped part of the discussion.
He said the idea of a forced sale in the United States had reached traders. The suggestion did not reflect any confirmed action, but it influenced how some large holders viewed risk.
John Bollinger Gives His View on Crypto Market Weakness
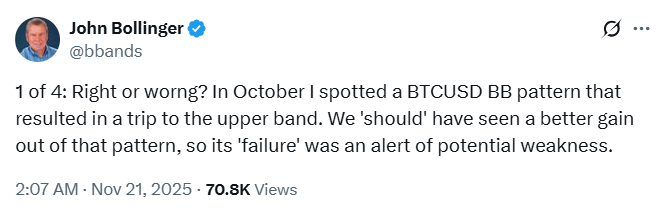
John Bollinger commented on a pattern he observed in October. Bollinger noted that Bitcoin reached the upper band on his indicator but did not extend the move.
He viewed this as a sign that market strength had faded. In his view, the signal pointed to weakness building in the chart.
The weekly decline grew sharper after new inflation data reduced hopes for a December rate adjustment.
Bitcoin price lost 7.3% during Thursday’s session and traded more than $96 billion in volume.
Market sentiment weakened amid the current outlook. The Fear and Greed Index dropped to 11, which reflected strong caution among traders.
Heavier selling came from the United States as the Coinbase Premium Gap moved to about -90.
This meant Bitcoin sold at a cheaper price on Coinbase than on Binance. Since Coinbase attracted more U.S. institutional users, the gap showed stronger selling from that region.
Liquidity providers also reduced activity during the fall. The spread widened as traders tried to reduce exposure.
Bitcoin Historical Momentum Now Broken
Quarterly closing data revealed the change in trend in Q4.
In 2024, Bitcoin quarterly data saw a gradual increase from $71,262 in the first quarter to $93,403 in the fourth quarter.
In 2023, the top coin jumped from $28,488 in Q1 to $42,241 in the fourth quarter.
Making sense of this, the figures indicated a sharp increase in Q4 after weaker levels in Q2 and Q3.
The rise generally shows that the market regained some strength before the next year began. The bullish moves also showed how quickly Bitcoin shifted during periods of heavy trading.
The Q4 data linked closely with conditions in late 2025. Traders had entered the period with strong expectations.
For context, the market then faced pressure as inflation numbers pushed investors toward caution.
The decline in 2025 broke the momentum that appeared to build at the end of the previous year. The image showed earlier strength, but the new sales in 2025 changed the trend.
The Q4 reading helped traders understand how the broader trend changed. It showed how Bitcoin moved from a strong finish in 2024 to a more unstable path in 2025.