Doge Pepe
 Zylo Ecosystem
 Crawlerpad
 Pearl
Pearl Quantus
 Starknet
 Quant
Quant

Hedera price continued its strong downward trend today, December 2, mirroring the performance of other top coins. It dropped to $0.1317, down by ~57% from its highest point this year. So, will the token rebound as the HBAR ETF inflows continue?
Hedera Price at Risk of More Downside
The daily timeframe chart shows that the HBAR price has crashed in the past few months. This happened as the crypto market crash has accelerated.
It dropped from the September high of $0.3043 to $0.1315 today. It’s a move that has dragged its market capitalization from over $13 billion to $5.5 billion today.
The token formed a death cross pattern on October 19 as the 50-day and 200-day EMAs crossed each other. This pattern often leads to more downside as it means that the short-term momentum is accelerating.
Hedera price has moved below the Parabolic SAR and the Supertrend indicators, which is another highly bearish chart pattern. HBAR price has slowly formed a head-and-shoulders pattern, whose head is at $0.3043, its highest point in September this year.
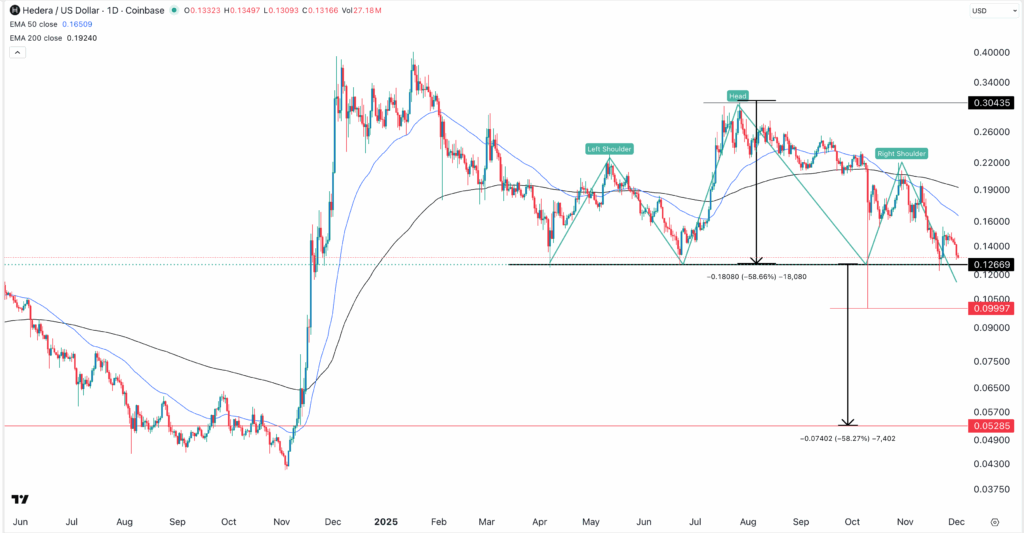
The shoulders are at $0.2305, while the neckline is at $0.1265. A H&S pattern is one of the riskiest signs in technical analysis. The technicals point to further downside for Hedera. A drop below the $0.1266 neckline could accelerate losses.
Measuring the distance from the head to the neckline shows that it is about 60%. The same distance from the neckline gives the potential Hedera price target to $0.0528, its lowest level in November last year.
This view will be confirmed when it drops below the neckline at $0.1266, followed by the October low of $0.099. A move above the $0.1650 Fibonacci level will break the bearish setup. It could signal more gains ahead.
Hedera Price at Risk Despite Soaring HBAR ETF Inflows
The bearish Hedera price forecast is happening despite the ongoing signs of demand for the token from American investors. Data compiled by SoSoValue shows that the Canary HBAR ETF has continued to attract inflows in the past few weeks.
It added $797k in assets on Monday this week, even as the crypto industry plunge gained steam. Most recently, it has had inflows for the last four consecutive days. With this, the cumulative net inflows have jumped to $80.2 million.
The Canary HBAR ETF, which has an expense ratio of 0.95%, now has $60 million in assets. It is equivalent to 1.05% of its market capitalization.
Still, its inflows lag those of other tokens. This includes popular names like Solana and XRP that have attracted over $600 million in assets each. This is understandable as Hedera is a less popular token than Solana and XRP.
For example, Hedera Hashgraph has just 24 DeFi applications in its network, with a total value locked (TVL) of $138 million. Its stablecoin in circulation has plunged from over $150 million in November to $75.8 million today.
Demand for Hedera Token Has Dropped Lately
Third-party data shows that demand for HBAR tokens has eased in the past few months. CoinGlass data shows futures open interest has dropped sharply. It fell to $131 million recently.
In July, it stood above $427 million. Its funding rate has started moving sideways since the large liquidation event in October.
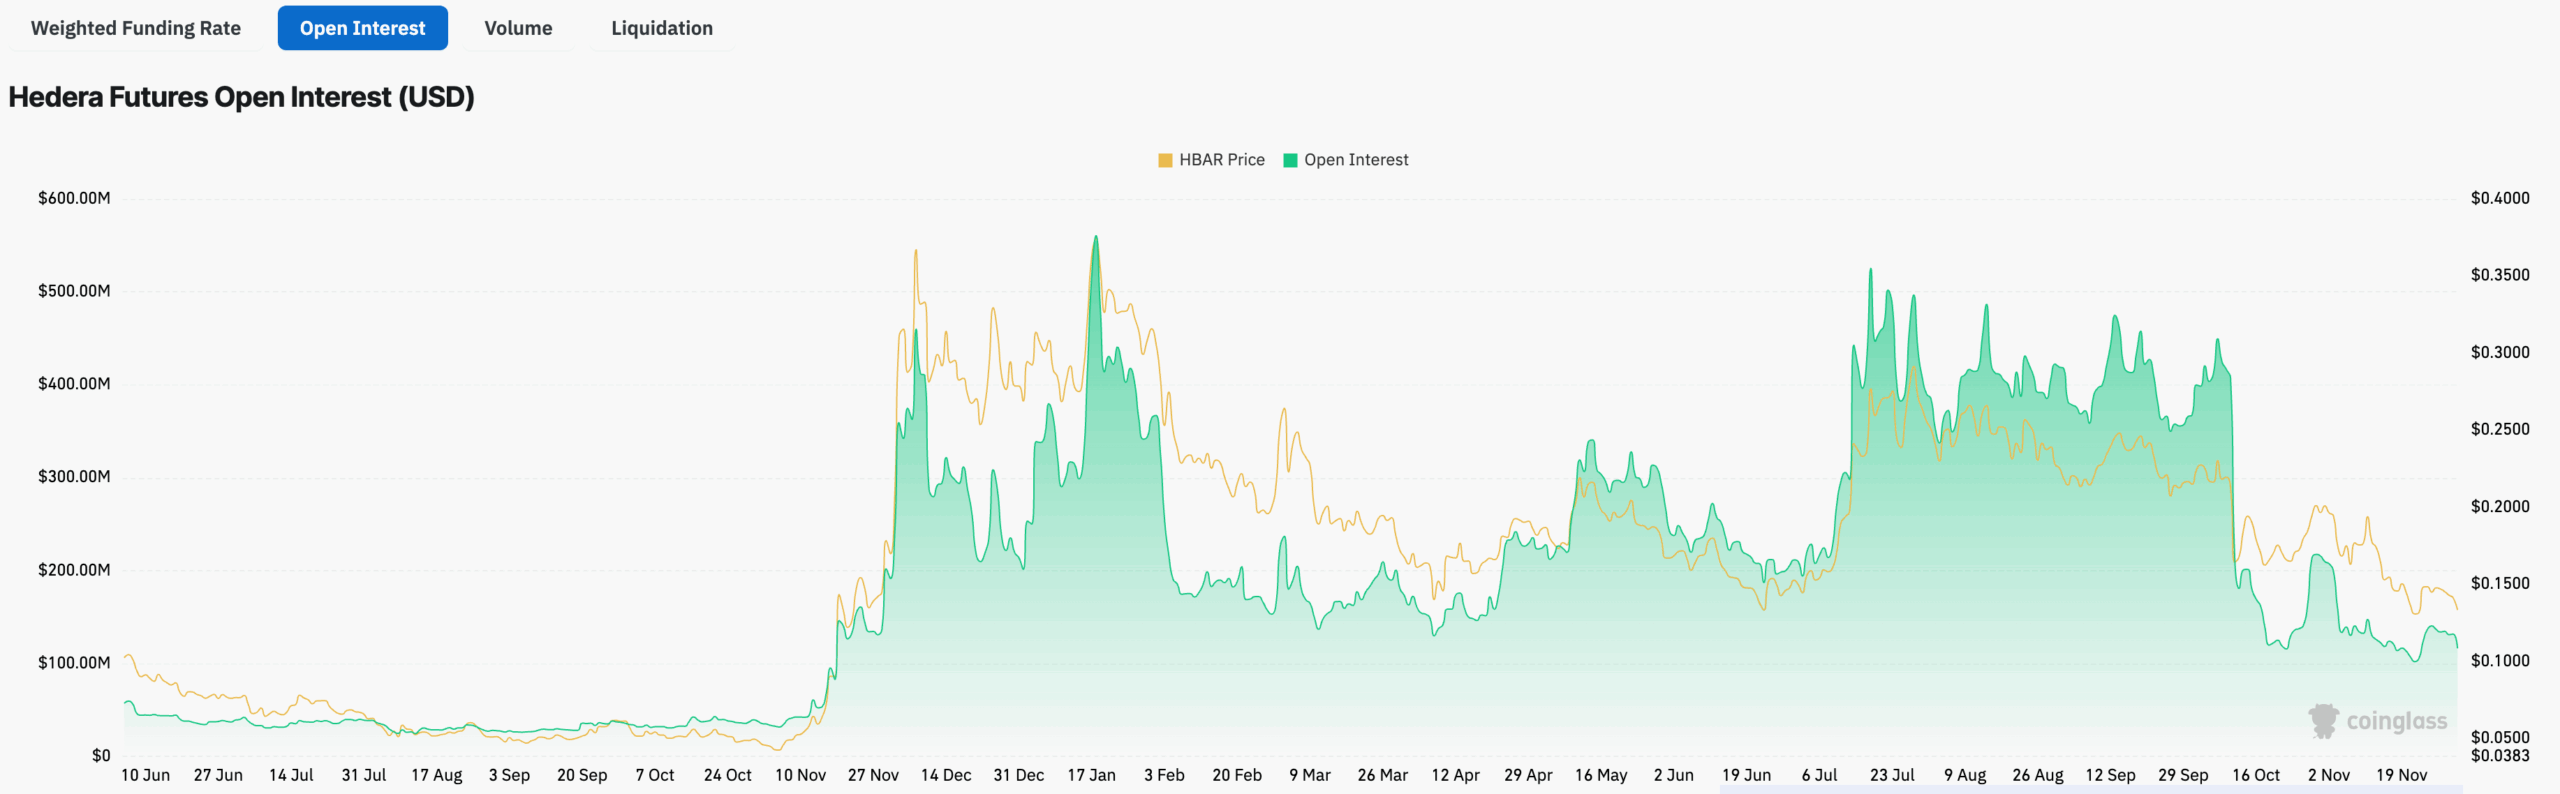
HBAR’s spot market volume has dropped sharply in recent weeks. It fell from $1.8 billion to just $160 million today.
Therefore, these fundamentals and technicals suggest that the token will likely have a strong bearish breakdown in the coming weeks. The only way it rebounds is if the crypto market recovers from the ongoing slump.