
 streamoors
 IGNITION
 Sword Inu
 no crying in the casino
 Altai the Tiger
 Pearl
Pearl Pudgy Penguins

Bitcoin price shows early technical signs of a momentum shift. Traders watch for a breakout in the daily Relative Strength Index.
At the same time, the price is stuck in a narrow range. This reflects the continuing uncertainty in the general crypto market.
Several analysts cite improving momentum and rising macro‑market correlations. They also point to cautious sentiment as a factor shaping Bitcoin’s near‑term outlook.
Bitcoin Price Daily RSI Breaks Long-Term Downtrend
Charts shared by Trader Tardigrade showed the Bitcoin daily RSI broke above a descending trendline. The line had remained intact for several months. This trendline was formerly a line of tops in repeated relief rallies, which reinforced bearish pressure.
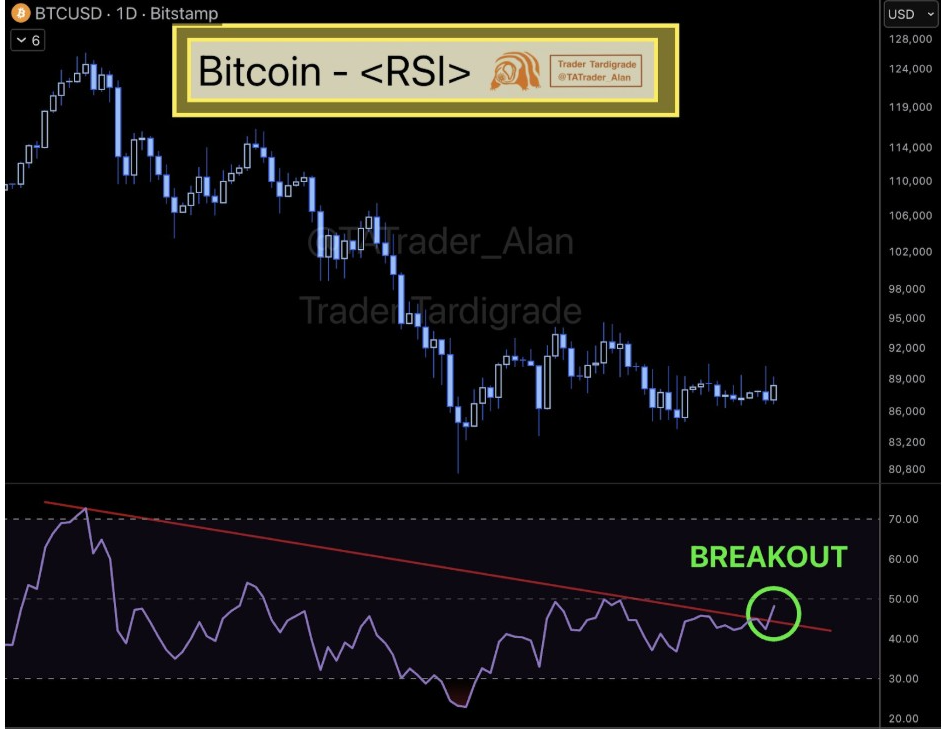
An RSI breakout is often a change in momentum and not immediate price expansion. In this situation, the indicator has indicated that selling pressure is giving way after a prolonged corrective period.
The RSI is now trying to stabilize above its mid-range zone, which historically is a trend transition. While RSI breakouts can precede upside moves, they need to be confirmed by price action.
Without a decisive reclaim of levels of resistance, the momentum shifts can stall. As a result, the RSI signal is still used by traders as an early indicator, rather than as a confirmed reversal.
Bitcoin Price Action Still Reflects Gold
Another development that is attracting attention is a rise in the correlation between Bitcoin and gold. In comparative charts shared by Rekt Fencer, both assets follow similar structural patterns over the recent months.
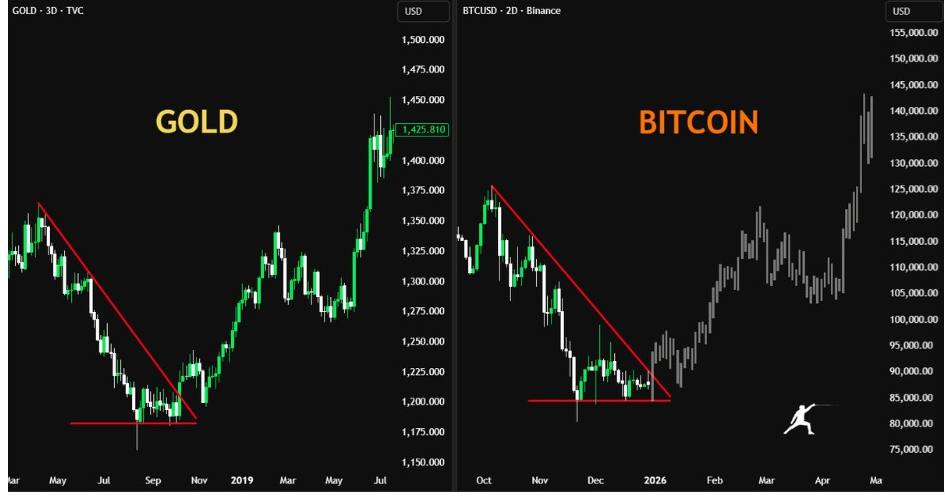
Gold just broke out of a descending formation recently and moved down to higher levels. Bitcoin seems to be playing catch-up to that move. This pattern has reinforced the view that Bitcoin remains sensitive to macro liquidity and risk dynamics.
Historically, gold tends to take the lead in times of uncertainty, with Bitcoin following when the clouds start to clear. The alignment suggests that Bitcoin may be responding to the same liquidity inputs, even if price confirmation has not yet occurred.
If this correlation holds, Bitcoin may be in store for a delayed upside move. However, confirmation still relies on BTC regaining significant psychological levels.
Market Sentiment and Liquidity Data Signals Stress
Market psychology metrics still reflect high caution. CryptoDeadline data shows the Fear and Greed Index remains near extreme fear. It was recently printed around 23.
Such conditions arise frequently during periods of prolonged consolidation or forced selling. Historically, these phases have coincided with bear trap set-ups. There, downside momentum is reduced before stabilization.
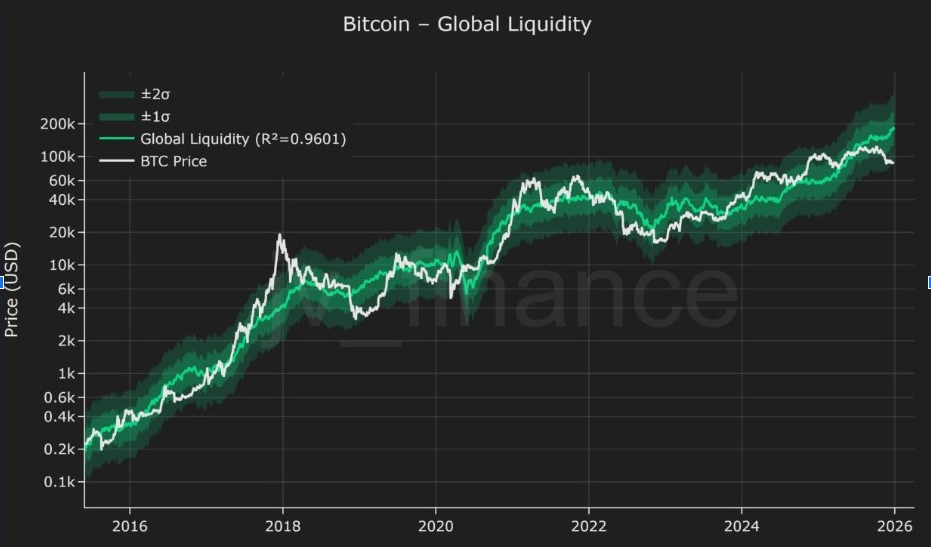
Long-term charts that compare Bitcoin price with global liquidity trends also indicate a strong relationship. Liquidity keeps on trending up, and the Bitcoin price is staying below previous highs.
This divergence does imply that price may be lagging behind macro conditions rather than rejecting them.
Support and Resistance Levels Define the Next Move
Despite improving indicators, Bitcoin price prediction continues to be range-bound. According to Ted Pillows, the BTC is still trading between $87,000 to $90,000. With this, neither side gains clear control.
The $90,000 level is still a critical resistance zone. A close above it every day would lead to less overhead supply and open the door to higher levels near $100,000. Until this point, upside attempts remain capped.
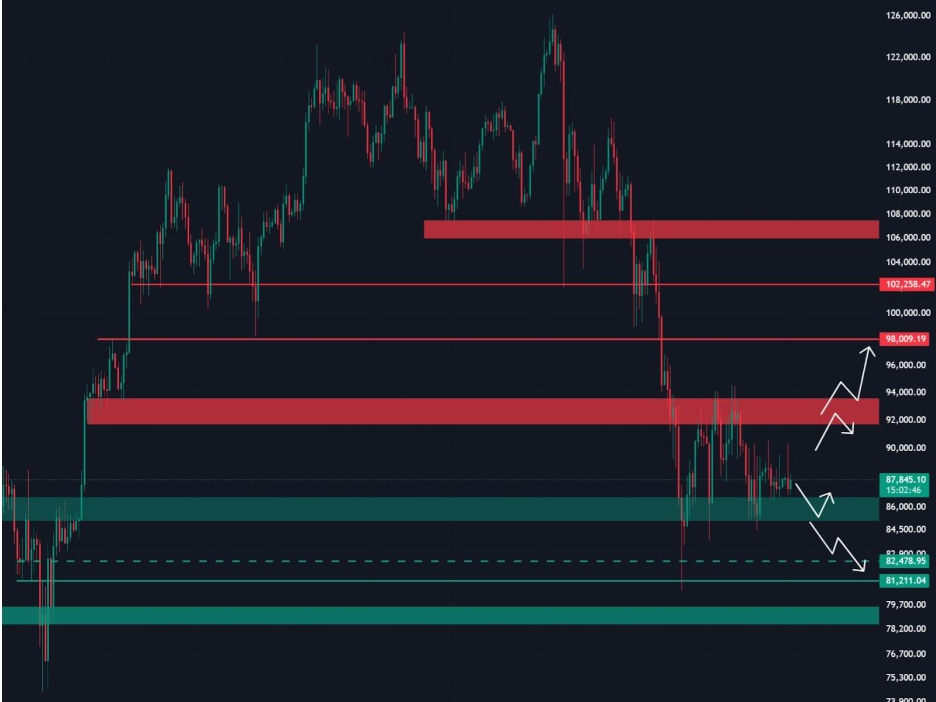
On the negative side, $87,000 can be regarded as near-term support. A loss of this level would probably result in $84,000 to $85,000 in lost demand, where prior demand has been formed. Deeper support lies around $81,000, aligned with wider liquidity areas.
Current price action showed Bitcoin consolidating above support rather than accelerating lower. This structure reflects indecision rather than aggressive selling.
As momentum indicators improve and the range narrows, traders are looking for confirmation. The next big move is to be the defining one for Bitcoin price prediction going into early 2026.



