
 Zylo Ecosystem
 Pearl
Pearl Walrus
 Derive
 Quantus
 Aerodrome Finance
 Sui
Sui

The MSTR stock price continued its strong downward trend, breaking crucial support, pointing to further downside as Bitcoin and other cryptocurrencies tumbled. Strategy dropped to $140, down sharply from its all-time high of $541. Will it drop to $100 as the Bitcoin crash continues?
MSTR Stock Price Could Crash to $100 After Losing Key Support
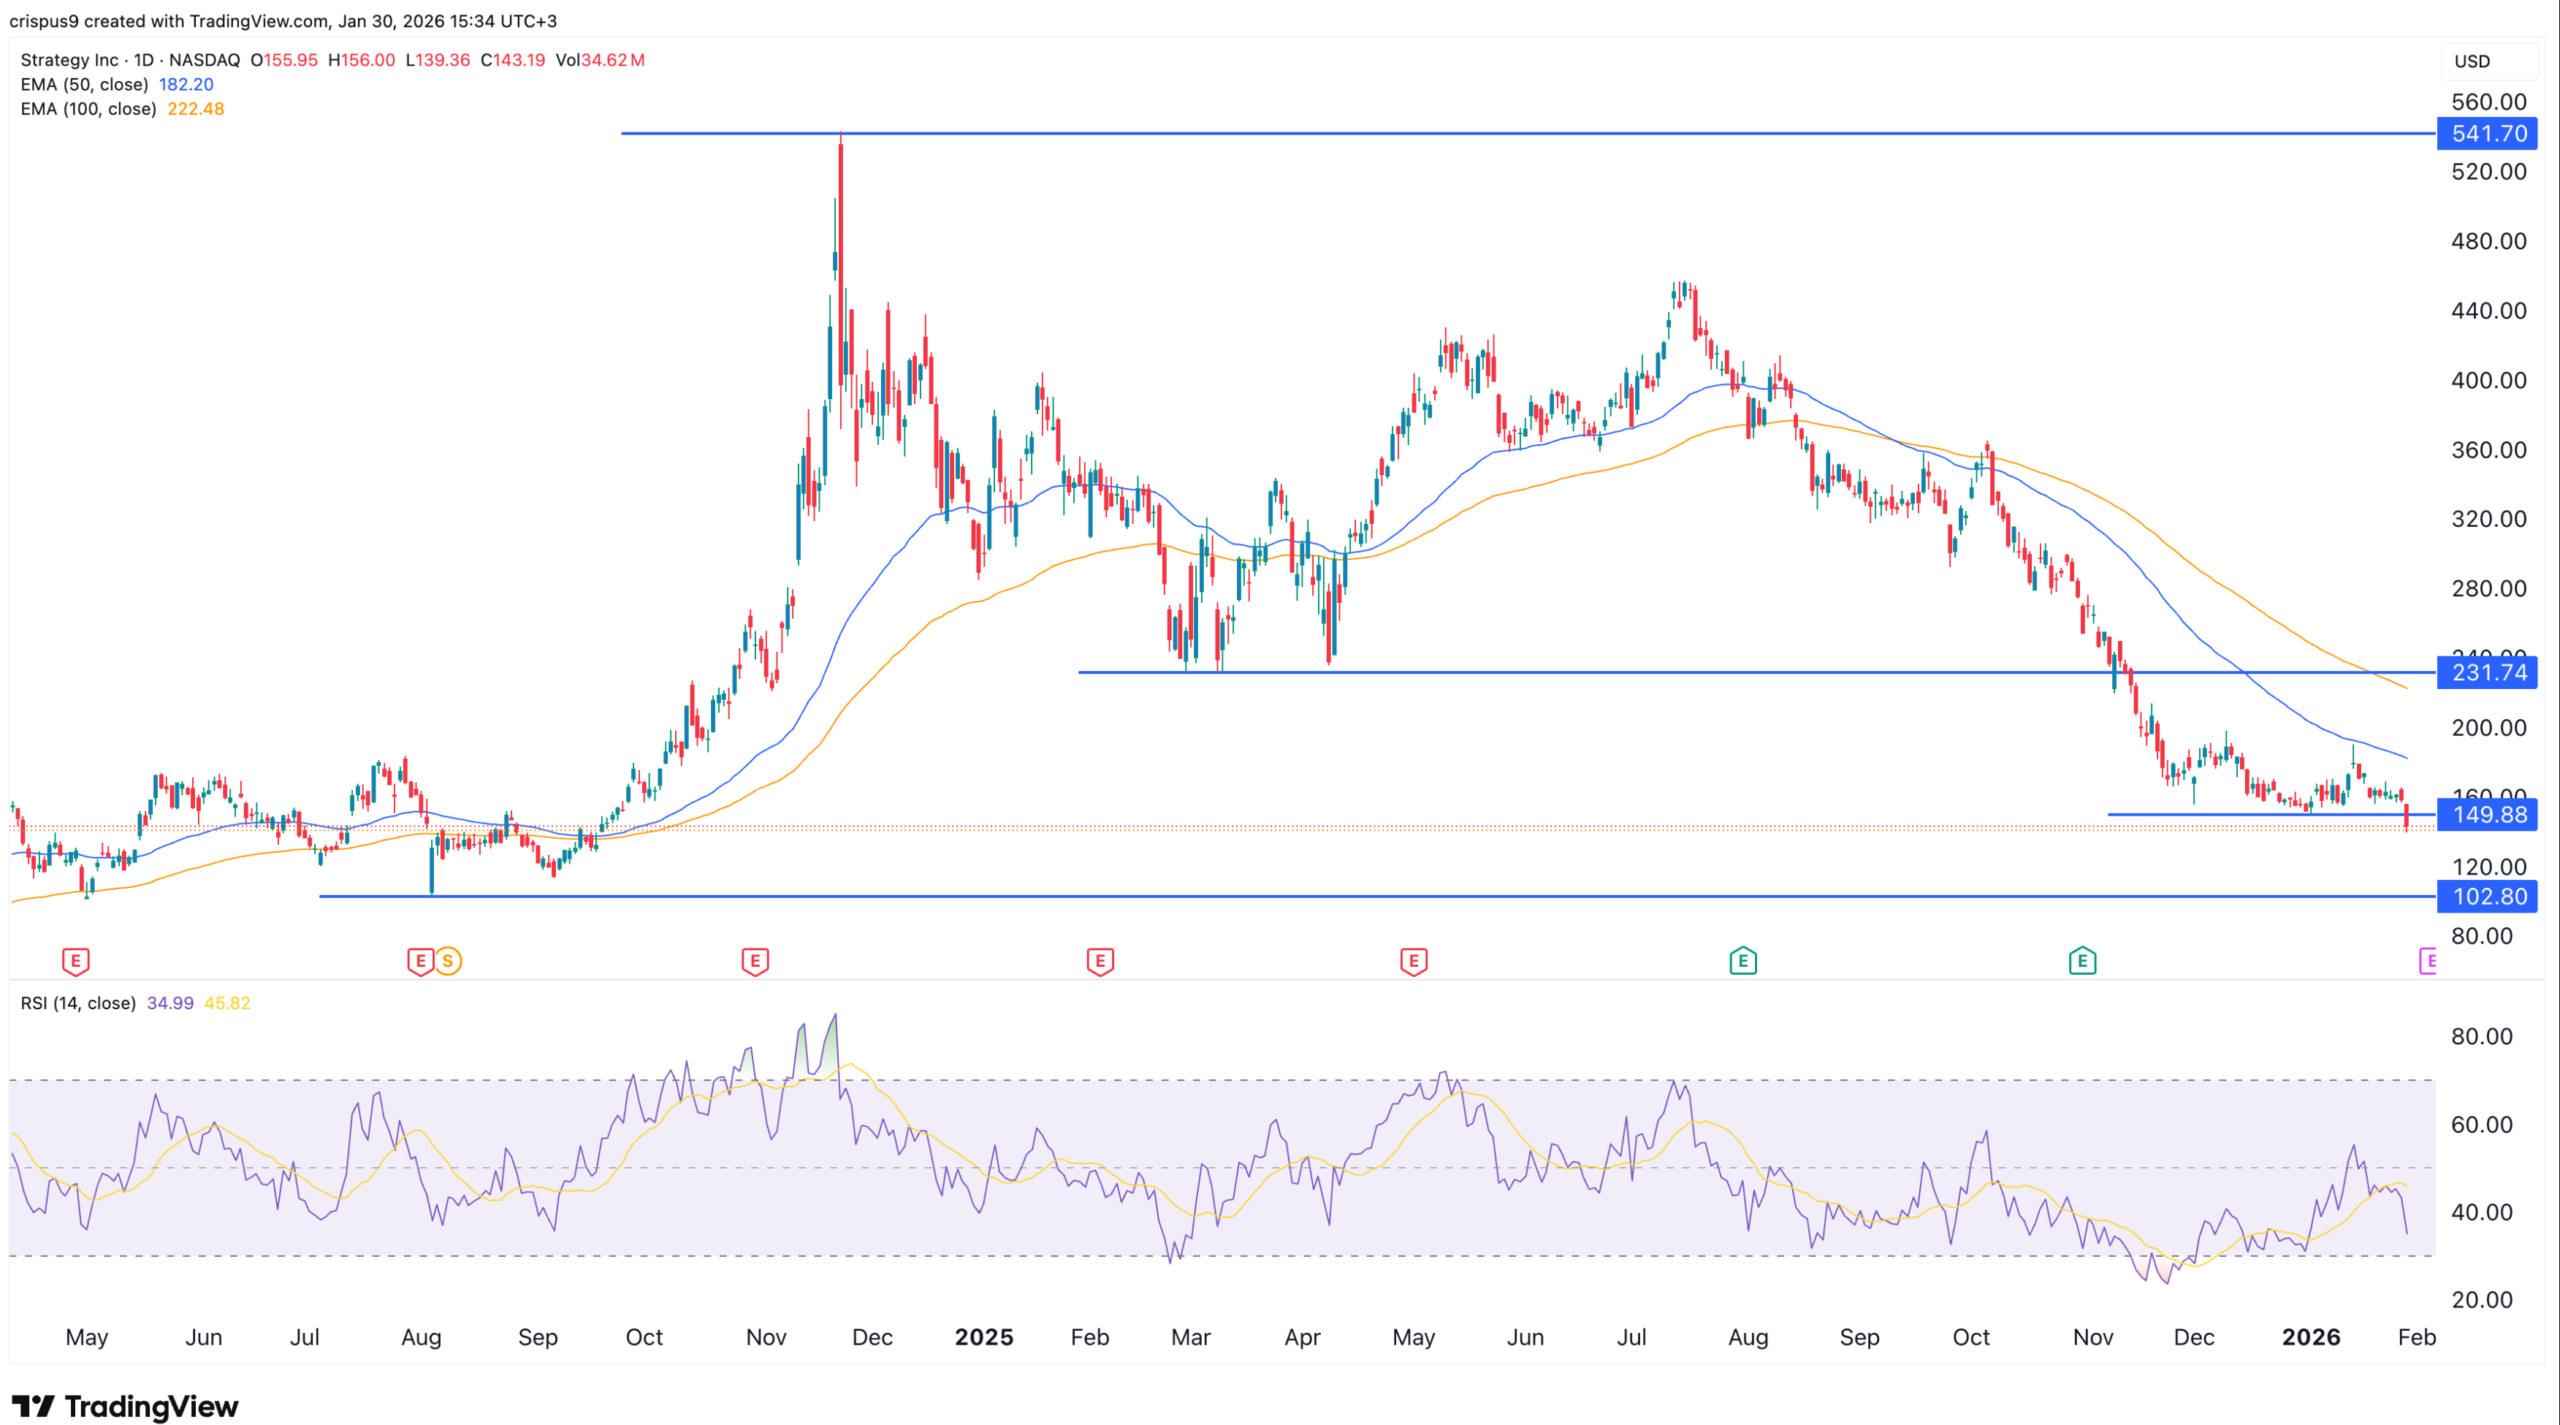
The daily timeframe chart shows that the MSTR stock price has come under pressure since November 2024, when it peaked at its all-time high of $541. This crash has led to a multi-billion-dollar wipeout, with the market capitalization dropping from over $130 billion to the current $41 billion.
MicroStrategy stock has lost several major support levels in the past few months. A notable one was $230, its lowest level in March and April last year. It also dropped below the key support level at $200 and $150, confirming the downward trend.
The stock has now plunged below the important support level at $149.88, its lowest level in December and this month. It was the lower side of the bearish flag pattern, a common bearish continuation sign in technical analysis.
Strategy share price has remained below the 50-day and 100-day Exponential Moving Averages (EMA) and the Supertrend indicators.
Additionally, the Relative Strength Index (RSI) has dropped and moved below the neutral point at 50 and is pointing downwards.
Therefore, the most likely MSTR stock price forecast is bearish, with the next key support level being at $100. This view will be confirmed if it loses the key support at $115, its lowest level in September 2024.
On the other hand, a move above the key resistance level at $200 would invalidate the bearish outlook and signal more upside.
Bitcoin Price Technical Analysis Suggests More Downside to Go
The best way to predict the future of the Strategy share price is to look at Bitcoin. Data shows that the company now holds 712,647 coins, currently worth over $58 billion.
Its Bitcoin accumulation strategy has returned just 8.6% in profit, and it’s likely to lose all those gains if the coin’s crash accelerates.
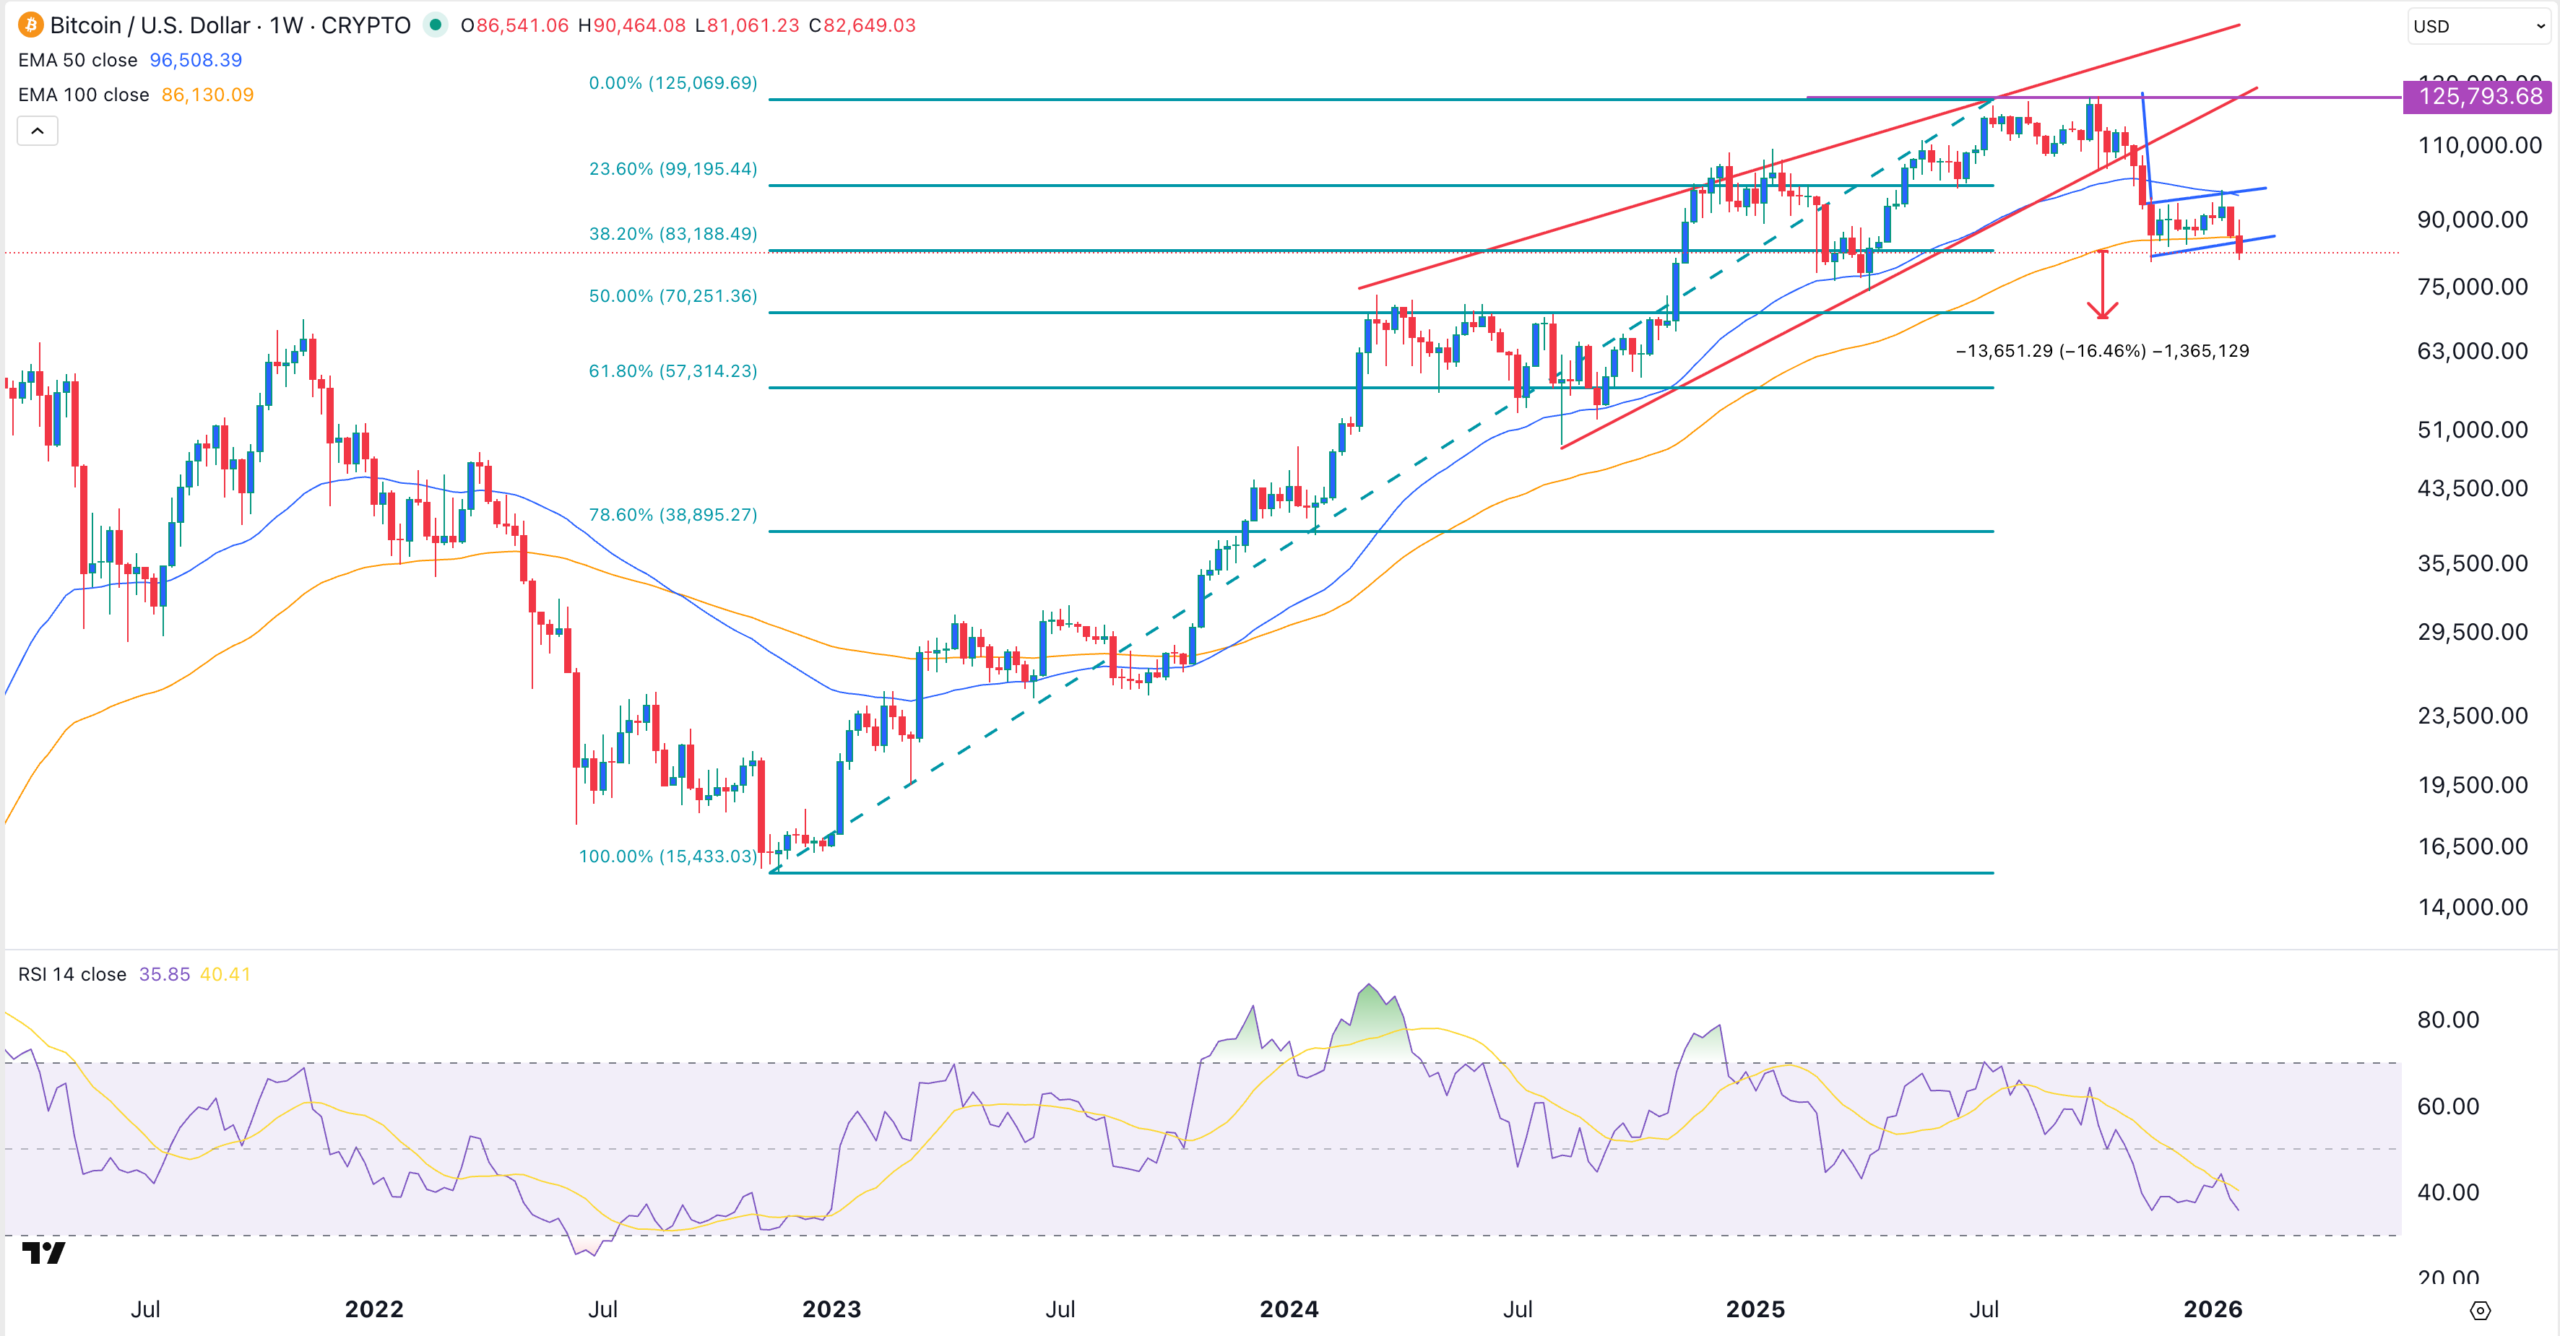
Unfortunately, there are signs that Bitcoin price has more downside to go, especially when you consider the weekly chart.
The weekly chart shows that the coin formed a giant rising wedge pattern between March 2025 and November last year. This pattern consisted of two ascending, converging trendlines. In most cases, this pattern usually leads to more downside, which has happened.
The coin also formed a bearish flag pattern, and today, it moved below the lower side. It also moved slightly below the 38.2% Fibonacci Retracement level at $83,188.
On top of this, the stock formed a bearish divergence pattern, which occurs when key oscillators like the Relative Strength Index (RSI) and the MACD decline while an asset’s price is rising steadily.
Therefore, the most likely Bitcoin price forecast is bearish, with the next key target being at the 50% Fibonacci Retracement level at $70,250. That drop is about 16% below the current level.
Bitcoin has some major fundamental challenges. For example, bullish liquidations have continued to rise over the past few months, a move that is pushing investors toward other, better-performing assets.
Most importantly, demand from American investors has continued falling in the past few months. These Bitcoin ETFs shed over $1.1 billion in assets this month, higher than the $1.09 billion they lost in December. They lost $3.4 billion in November, bringing the cumulative net inflows to $55.2 billion.
Bitcoin has also struggled despite favorable conditions, including a Federal Reserve that has cut interest rates three times and launched quantitative easing. Also, its role as a safe-haven has faded, with its performance lagging other assets as risks rose.



