
 Pearl
Pearl Zylo Ecosystem
 Sui
Sui Starknet
 Pons
Pons NEAR Protocol
 Quantus

HBAR price is trading near $0.074 as Hedera approaches a descending trendline that has capped several recovery attempts during 2026.
Crypto analyst Crypto Patel identified an accumulation region between $0.067 and $0.072, with $0.08244 serving as the key breakout threshold. His setup requires a daily close above that level and a successful retest before the broader bullish structure gains confirmation.
HBAR remains below that resistance after recovering from its mid-August low near $0.0646. The token reached approximately $0.0843 on Aug. 25 before retreating, leaving the $0.082–$0.084 region as an important technical barrie
HBAR Price Builds Inside an Accumulation Zone
HBAR price has spent recent months trading below a descending trendline that has repeatedly limited upside moves. The latest setup places the token near the upper edge of an accumulation area, where buyers have previously stepped in around the $0.067 to $0.072 range.
CryptoPatel’s setup uses $0.06423 as the stop-loss level and treats $0.08244 as the main breakout point. The analyst said the structure becomes stronger only after a daily close above that resistance, followed by a successful retest. That condition would provide a clearer technical confirmation than an intraday move through the level.
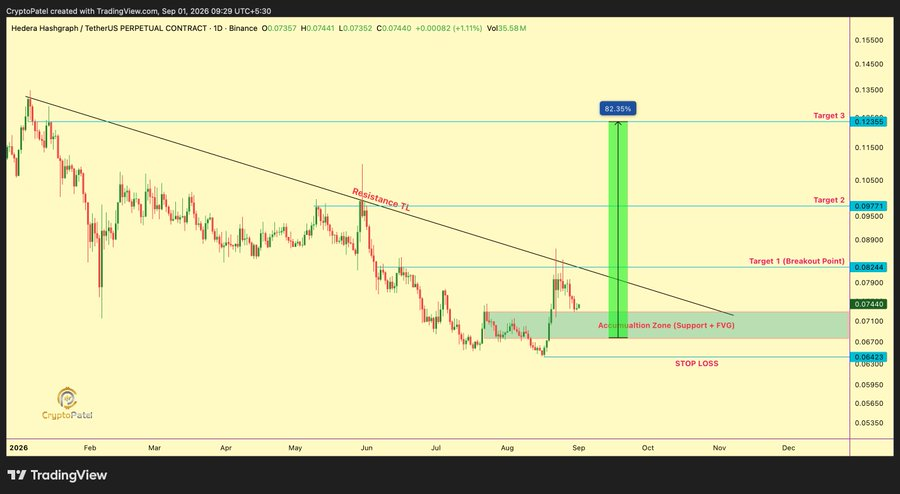
The daily structure shows a recovery from the accumulation zone toward the descending trendline. HBAR price must overcome that line to change the short-term pattern.
Breakout Level Sets the HBAR Price Prediction
The first upside target stands at $0.08244, which also serves as the breakout point in the setup. A sustained move above it would place the next target at $0.09771, followed by $0.12355.
The chart also places HBAR below a falling resistance line that extends across the earlier 2026 price action. A daily close above $0.08244 would therefore mark a break from that structure. Without that close and retest, the proposed trend reversal remains unconfirmed.
Buyers would need to defend the accumulation zone while waiting for confirmation above resistance. A failure at the trendline could keep HBAR inside the existing range.
HBAR Double-Bottom Pattern Adds Longer-Term Context
A separate daily-chart analysis identifies a potential double-bottom structure near $0.075. That setup uses about $0.22 as the neckline and projects a measured range of $0.34 to $0.39 after a confirmed breakout.
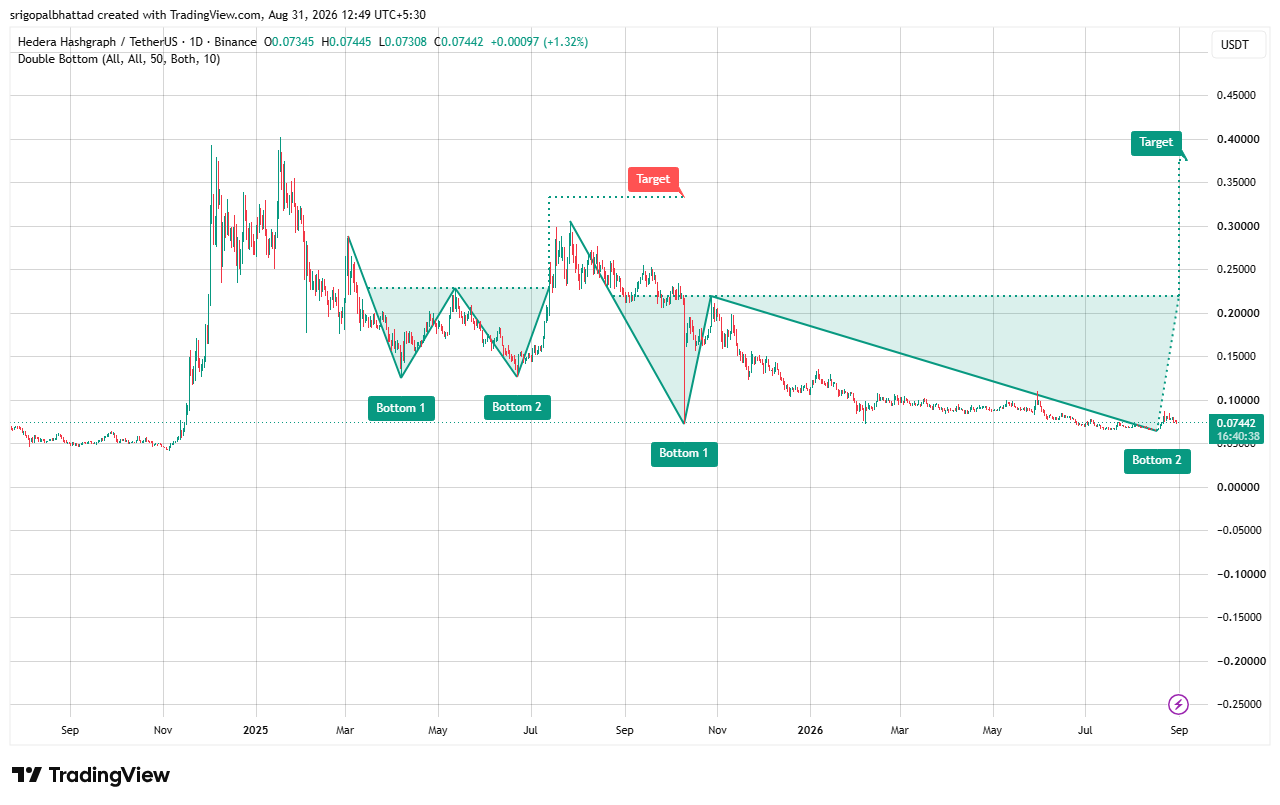
The two technical setups use different timeframes and levels. The shorter-term trendline structure focuses on $0.08244, $0.09771, and $0.12355, while the broader double-bottom analysis requires a move above $0.22.
The double-bottom formation provides broader chart context, while the descending trendline setup focuses on near-term resistance. A move through either confirmation level would strengthen that structure.
HBAR Crypto Market Data and Key Risk Levels
At the time of writing, HBAR traded near $0.07406, with a market capitalization of about $3.23 billion. Futures volume stood at $66.52 million, spot volume reached $16.09 million, and open interest was about $108.99 million. Circulating supply stood at 43.83 billion HBAR out of a total and maximum supply of 50 billion.
Liquidation data showed $27.45K in positions closed over 24 hours. Shorts accounted for $14.23K, while longs accounted for $13.22K. Over four hours, long liquidations reached $12.53K out of $12.89K. The figures show active positioning as HBAR crypto tests nearby resistance, with traders closing positions during the recent moves.



