Injective
 Bitcoin
 Quantus
 Sui
Sui Derive
 Pump.fun
 Quant
Quant

Ethereum price has climbed about 86% from its June low of $1,506 after reaching $2,806 this month. ETH crypto trades near $2,670, up about 10% in the last 7 days as the market pulls back from that recent high. At the same time, Bitfinex ETH short positions have climbed to about 73,056 ETH, their highest level in 51 months. The sharp rise in shorts now puts the $2,550 support area and ETH/BTC strength in focus.
Ethereum Price Prediction Sees $2,550 as Key Support
The ETHUSD weekly chart places the first support area around $2,550. The level also sits near the 100-week EMA at $2,558. Ethereum recently moved above this moving average after recovering from its June low. Buyers now need to defend this area to preserve the recovery structure.
ETH crypto deeper pullback would shift attention toward the $2,180 area. Ethereum price prediction also marks lower support near $1,965 and $1,713. These zones previously attracted demand during the recovery from the second-quarter selloff. However, Ethereum would first need to lose the $2,550 region before those lower levels become relevant.
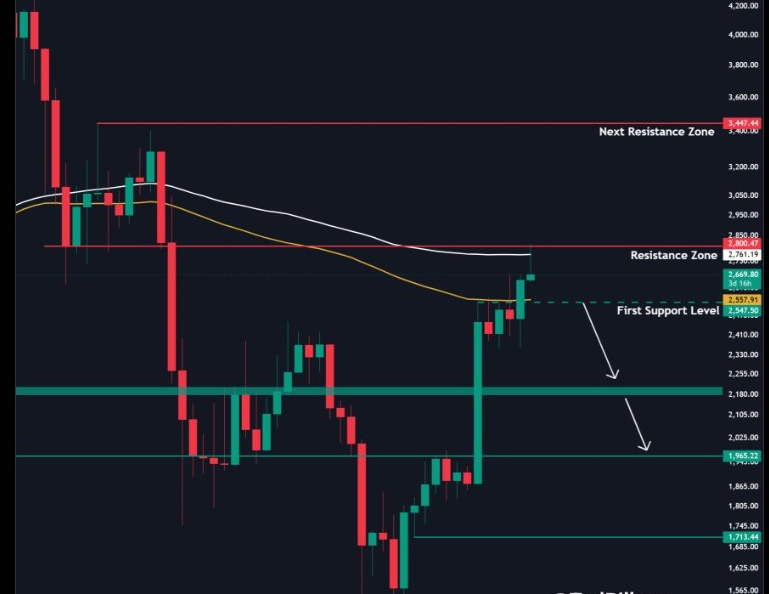
On the upside, the 100-week SMA near $2,761 creates the first nearby hurdle. The chart places another resistance zone around $2,800, close to Ethereum’s recent September high. A weekly move through that region would open room toward the larger resistance level near $3,447.
Bitfinex ETH Shorts Surge to 73,056 ETH
Bitfinex ETH short positions have risen sharply during September. TradingView data places the total near 73,056 ETH on September 24. The increase takes short positions to their highest level in roughly 51 months.
The latest weekly change also stands out. Bitfinex ETH shorts increased by more than 53,800 ETH, or about 280%, during the move shown on the chart. Short exposure now sits far above the levels recorded throughout most of 2023, 2024, and 2025.
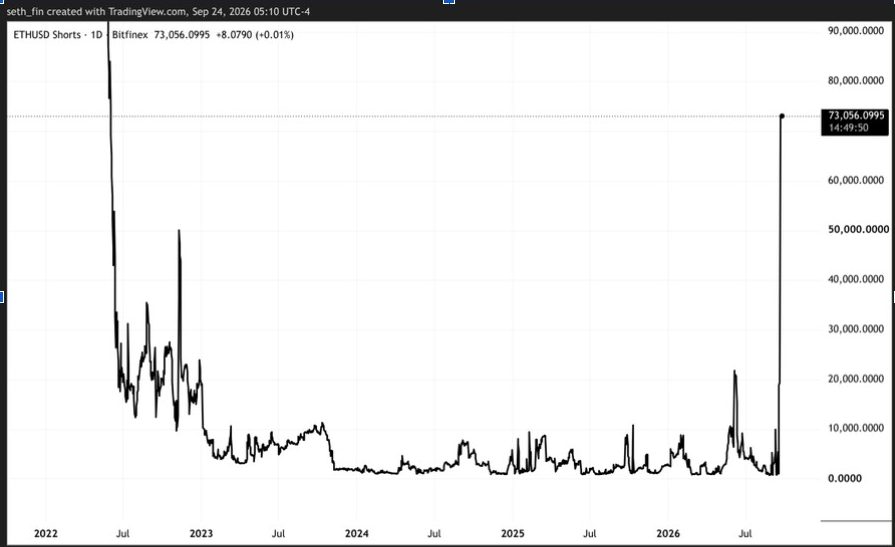
Past increases in Bitfinex shorts often coincided with periods of Ethereum price weakness. The current setup differs because ETH has held much of its recovery from the June bottom.
ETH/BTC Strength Keeps Altcoin Momentum in Focus
Meanwhile, ETH/BTC weekly chart also gives another view of Ethereum’s position within the crypto market. The pair rebounded strongly from its 2025 low and entered a consolidation phase after its main rally.
ETH/BTC rises when Ethereum outperforms Bitcoin. Traders watch the pair for signs that altcoins are gaining strength.
The current Ethereum price prediction compares the structure with the 2020 to 2022 cycle. During that earlier period, ETH/BTC moved from a bottom into a strong rally before spending months in consolidation. The current chart maps a similar sequence of a bottom, rally, and sideways period.
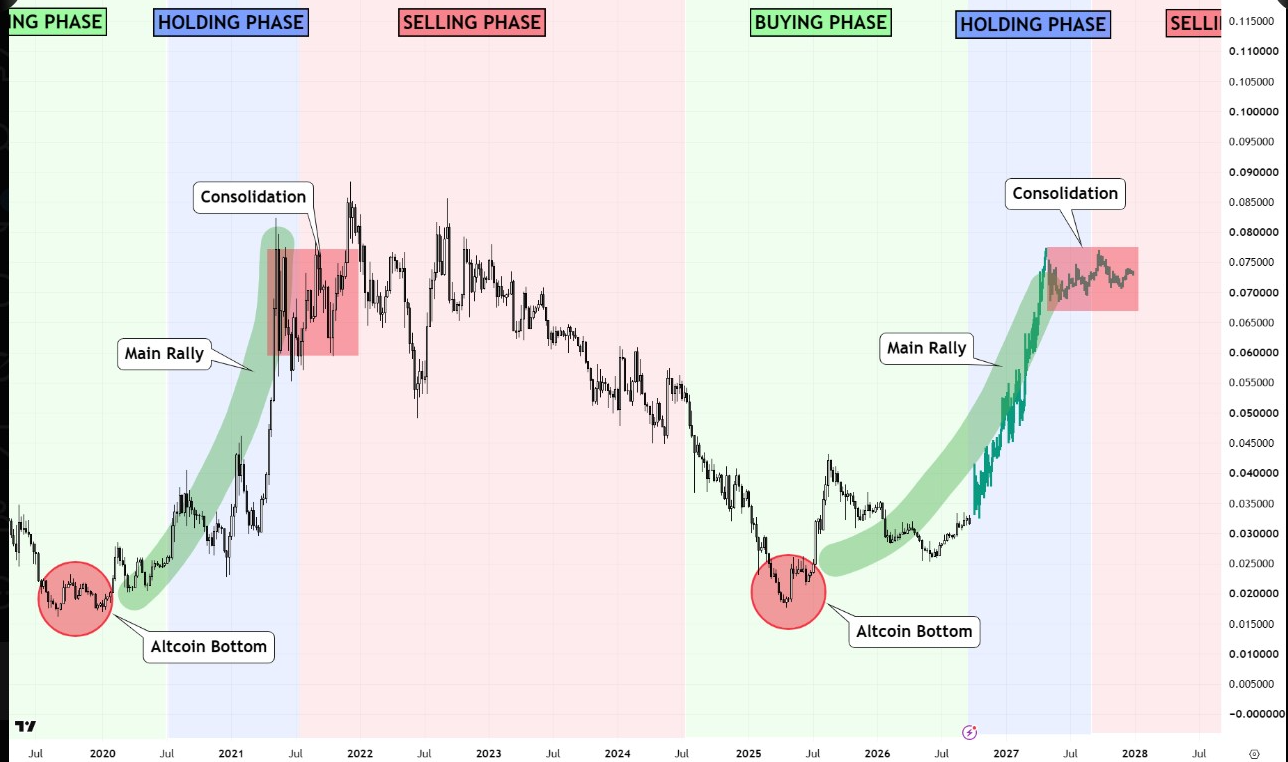
ETH/BTC would still need to break from its present consolidation range before showing another clear phase of relative strength against Bitcoin.
Therefore, Ethereum price sits between a clear support area and a nearby resistance cluster. The weekly chart places support around $2,550, while the $2,761 to $2,800 zone forms the next barrier. Holding $2,550 would keep Ethereum above its 100-week EMA.
This article is for informational purposes only and does not constitute financial or investment advice. Technical levels and derivatives positioning do not guarantee future price movements.