
 streamoors
 IGNITION
 Sui
Sui Quantus
 Bitcoin
 Pearl
Pearl Solana

Key Insights:
- Dogecoin’s RSI breakout signals rising bullish momentum, surpassing key resistance levels.
- A falling wedge pattern suggests a possible breakout, with resistance levels key to Dogecoin’s next move.
- On-chain data shows a surge in active addresses, signaling increasing demand and network growth.
Dogecoin price (DOGE) has staged a notable recovery, surpassing the $0.205 mark after facing a week-long decline. The broader cryptocurrency market downturn was driven by President Donald Trump’s tariffs on competitor countries.
Despite this rebound, DOGE’s weekly and biweekly performance remain negative, showing declines of 16% and 25.7%, respectively. Market indicators suggest that Dogecoin has broken significant levels, potentially paving the way for further gains.
Momentum Shift Indicated by RSI Breakout in Dogecoin Price
Dogecoin’s price chart signals a steady increase in buying activity, with a 10.5% gain over the past 24 hours. A technical analysis shared by Trader Tardigrade highlights key trends in the DOGE/USD 4-hour timeframe.
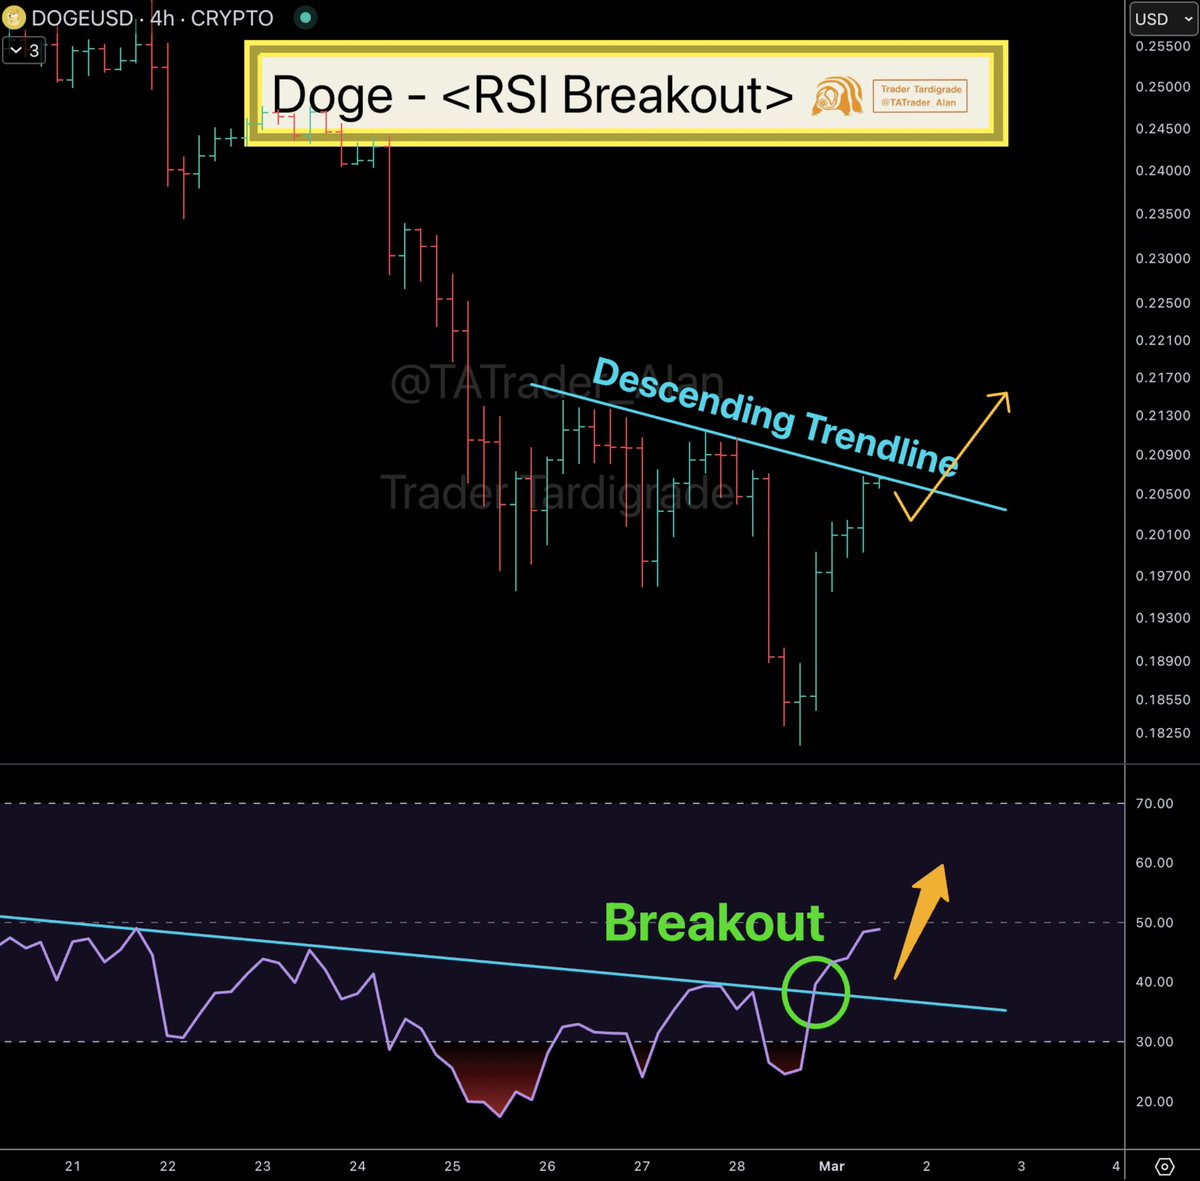
The focus is on the Relative Strength Index (RSI), a momentum oscillator that had been moving below a descending trendline for several days.
A breakout above this trendline has now occurred, signaling a rise in bullish momentum. The RSI has moved past the 40 mark and is approaching 50, a crucial level that distinguishes recovery from a confirmed bullish trend.
Values below 30 indicate oversold conditions, while levels between 30 and 50 suggest improving momentum. A reading above 50 typically confirms bullish strength. The analysis suggests that a successful breakout from the descending trendline could push Dogecoin toward the $0.217 level.
Falling Wedge Pattern Points to Potential Breakout
A separate TradingView analysis of the DOGE/USDT daily chart on Binance highlights a falling wedge pattern. This pattern, often associated with bullish continuation, suggests that Dogecoin could see an upward breakout if market conditions align.
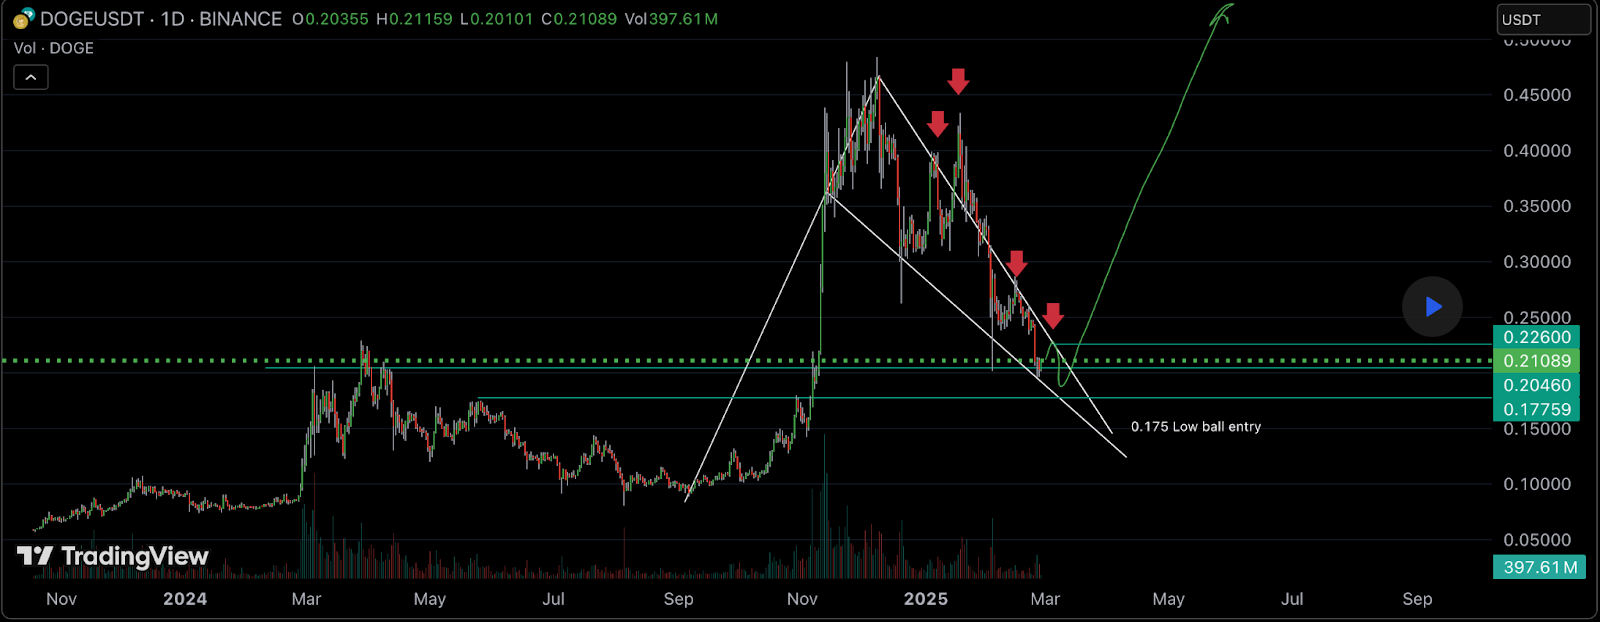
DOGE’s price action has remained within a contracting range, forming lower highs and lower lows. Multiple rejections from the descending resistance line confirm persistent selling pressure. The analysis notes that a breakout beyond this resistance could drive significant upward movement. However, the analyst anticipates an interim low around $0.175 before a potential sustained breakout. The $0.235 level remains a key threshold to monitor, as it could confirm a breakout or signal further rejections before any upward momentum solidifies.
Dogecoin Long-Term Support and On-Chain Activity Surge
In a separate chart, analyst Ali Martinez observes Dogecoin’s value action in a long term ascending channel. Levels at which the support and resistance zones line up with future key Fibonacci retracement levels.
One can also note that DOGE has resisted falling below the $0.185 support level, which had acted as resistance at the end of 2021 and for the early part of 2022. Given the significance of this level, it would be a good foundation for more price stability, according to Martinez.
Additionally, on chain data from the IntoTheBlock shows a large spike in the network activity. Additionally, the metric of 7 day daily active addresses (DAA) has increased by 111.32% and this signifies that more people are using it.
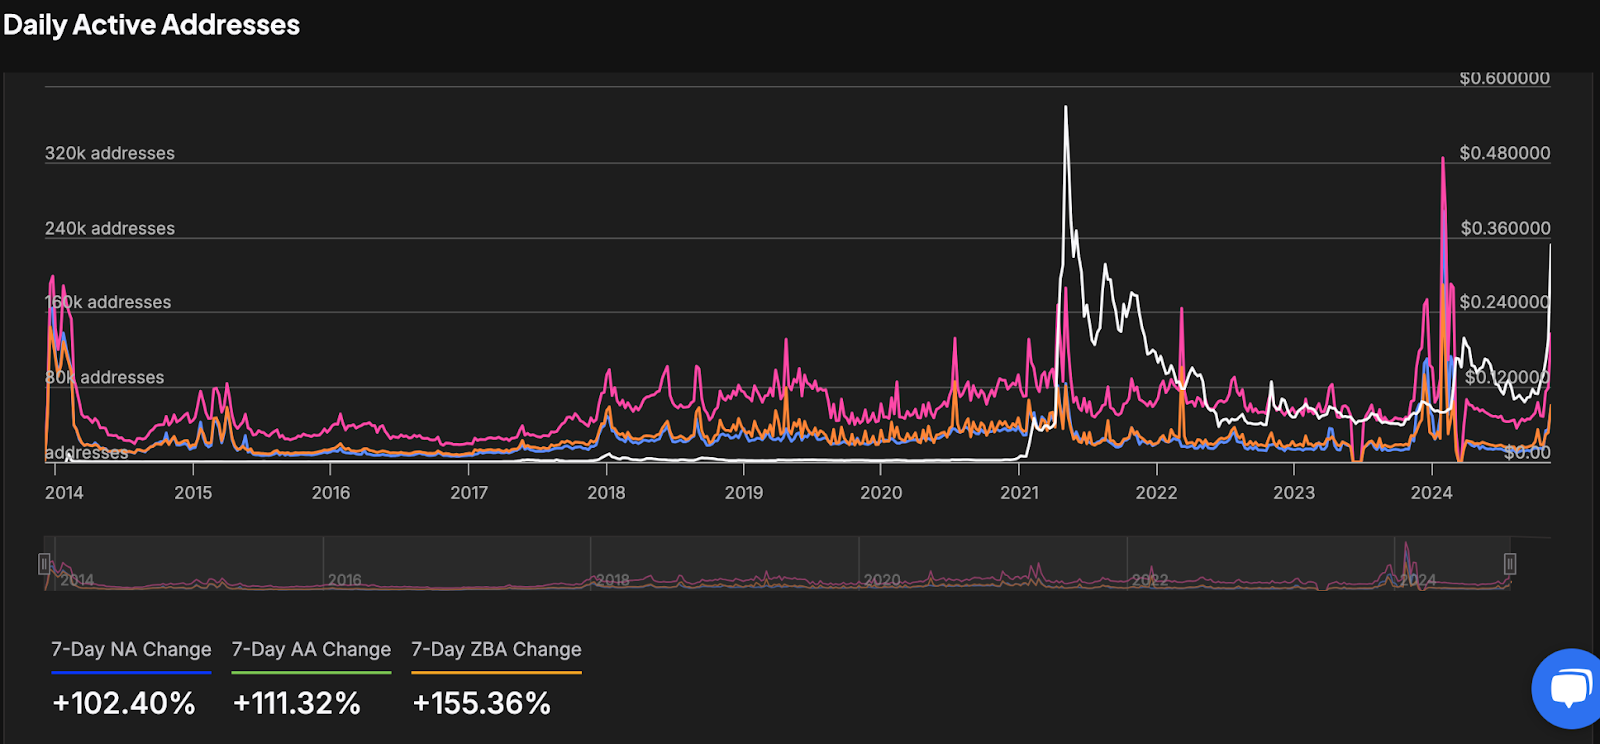
Furthermore, the number of zero balance addresses (ZBA) has increased by 155.36%, which indicates an inflow of new wallets. Also, a 102.40% growth in new addresses (NA) implied the urge for buying Dogecoin.
Disclaimer
This article is for informational purposes only and provides no financial, investment, or other advice. The author or any people mentioned in this article are not responsible for any financial loss that may occur from investing in or trading. Please do your research before making any financial decisions.




