
 Altai the Tiger
 IGNITION
 streamoors
 Sword Inu
 NEAR Protocol
 Injective
 Quantus

The Value Days Destroyed (VDD) metric hints at easing selling pressure on the price of Bitcoin (BTC) long-term holders (LTHs). This move has raised questions about whether the price of BTC has found a bottom.
Analysts are hopeful about BTC’s potential, citing historical price patterns. However, recent outflows from the spot BTC exchange-traded fund (ETF) market have reduced the bullish price outlook.
Bitcoin Price VDD Signal Analysis
Data analytics provider CryptoQuant noted that VDD is declining. The metric is approaching levels seen in past corrections, suggesting that LTH selling pressure is easing.
LTHs holding Bitcoin for extended periods represent a powerful selling pressure, especially during market peaks. Their action is still capable of causing a shakeout in the crypto market.
CryptoQuant noted that this scenario played out when Coin Days Destroyed (CDD) spiked at Bitcoin’s all-time high, signaling heavy selling by LTHs.
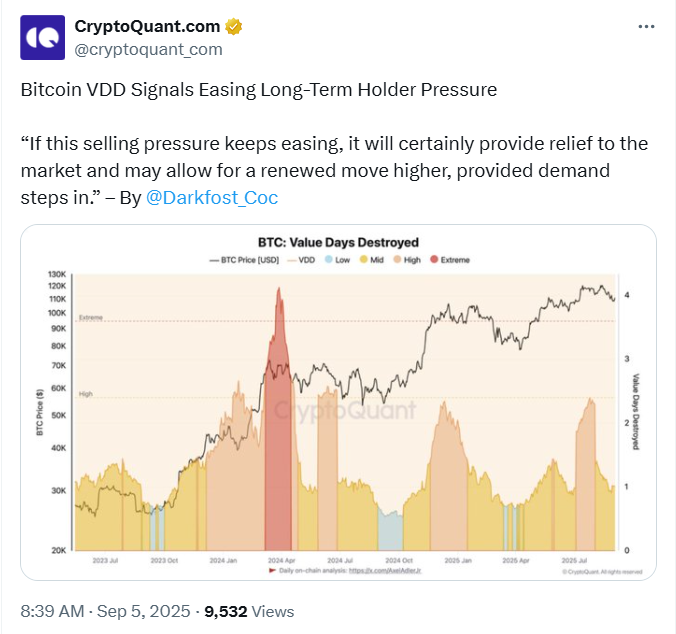
VDD is similar to CDD but factors in both holding time and price, reflecting the value of coins moved. A high VDD indicates strong selling by LTHs, often correlating with market tops or corrections.
However, the VDD metric has continued to decline since reaching a significant level of 2.4. If this trend continues, reduced selling pressure could stabilize the market. It could also support a potential price increase, assuming sufficient buying demand emerges.
In short, the easing of VDD signals that LTHs are selling less. This may pave the way for Bitcoin’s price to recover if demand picks up.
As of this writing, BTC is valued at $112,332, up 1.23% over the past 24 hours. The market cap stood at $2.2 trillion, with trading volume over $47.8 billion.
Bitcoin Price Multi-Year Analysis
Crypto market analyst with the username SuperBitcoinBro on X noted that Bitcoin has formed a multi-year monthly pattern.
The analyst emphasized that Bitcoin price multi-year monthly patterns are usually accurate and reliable. This suggests that Bitcoin price behavior on a monthly timeframe has followed consistent cycles over multiple years.
SuperBitcoinBro mentioned the $280,000 as a likely price target for Bitcoin, implying strong confidence in a significant upward move. His projection is based on past cycle peaks and technical analysis of monthly charts.
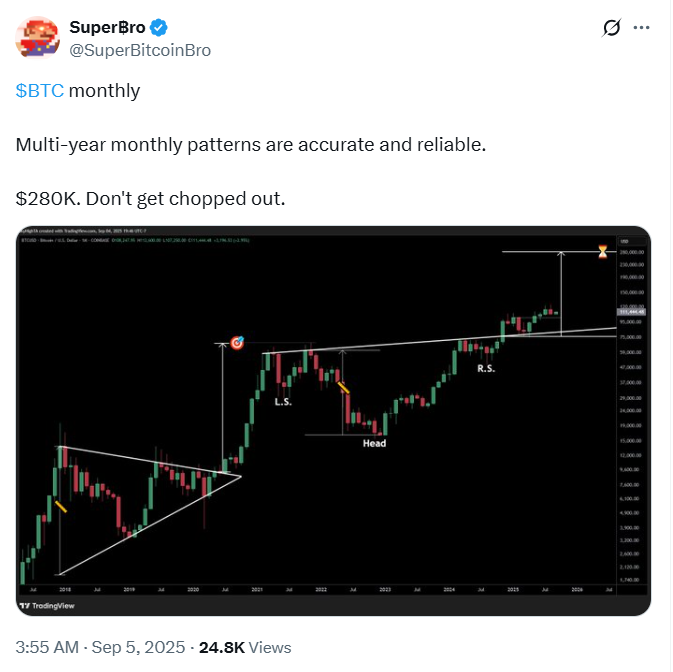
The analyst encouraged investors to hold for the anticipated long-term gain. He further pointed out a head-and-shoulders pattern that formed on the BTC chart.
According to the analyst, this setup started when BTC price was $43,000. The pattern accurately forecasted the ATH before the halving, the duration of the right shoulder, and the depth of this year’s retest.
Now, the analyst said he is counting on it to forecast the top. However, another analyst, Ali Martinez, highlighted that the Chande Momentum Oscillator (CMO) is below 20, indicating bear markets.
The ETF Market and Expectations
The spot market is another key factor to watch for the Bitcoin price future outlook. On Thursday, September 4, the spot ETFs saw outflows of $222.9 million. These outflows have raised bearish sentiments about BTC.
However, according to Farside Investors, BlackRock’s IBIT stood out, recording inflows of $134.8 million.
Meanwhile, the ETFs recorded total net inflows of $332.8 million and $300.5 million on Tuesday and Wednesday, respectively. Thus, if momentum in the market resumes, BTC is likely to hit new records.
Since debuting in January 2024, the spot Bitcoin ETFs have recorded key milestones. For instance, the ETFs have crossed the $50 billion mark in net inflows.
This follows the BTC rally to $112,000 following increased corporate demand and whale activity. Additionally, the ETFs account for over 30% of the total spot BTC trading volume.




