
 IGNITION
 streamoors
 Injective
 NEAR Protocol
 Pearl
Pearl LayerZero
 Quantus
Gold dropped sharply, its market value diving more than $2.5 trillion in two days. The metal has now slipped 8%, its sharpest two-day decline since 2013. Analysts are mixed on whether this signals a long-term peak or a correction before another rally.
Gold Down Record Two-Day Drop Since 2013
According to The Kobeissi Letter, Gold lost 8% in just two days, the worst performance in over a decade. The sell-off wiped out more than $2.5 trillion in global market capitalization. This historic decline has sent shockwaves through commodities markets, with gold trading near $4,042 after hitting $4,375 earlier this week.
The sharp correction is a signal of renewed volatility across safe-haven assets, driven by changing investor sentiment and increasing Treasury yields. Traders point out that the last comparable drop happened in April 2013, during a similar liquidation event caused by the liquidation of the futures market.
On the technical side, daily charts show a breakdown from the $4,150-$4,175 consolidation area, validating strong downside momentum. Analysts caution that selling pressure could continue unless buyers anchor the $4,000 psychological level.
Analysts Warn October May Mark a Major Peak
Analyst CryptoELITES believed that gold’s cycle has already topped out, setting October 2025 as the peak month. There is a recurring pattern on his long-term chart, and the highs since 2011 have topped out along the same resistance trendline. Each previous rejection was followed by long consolidation phases before a new leg up.
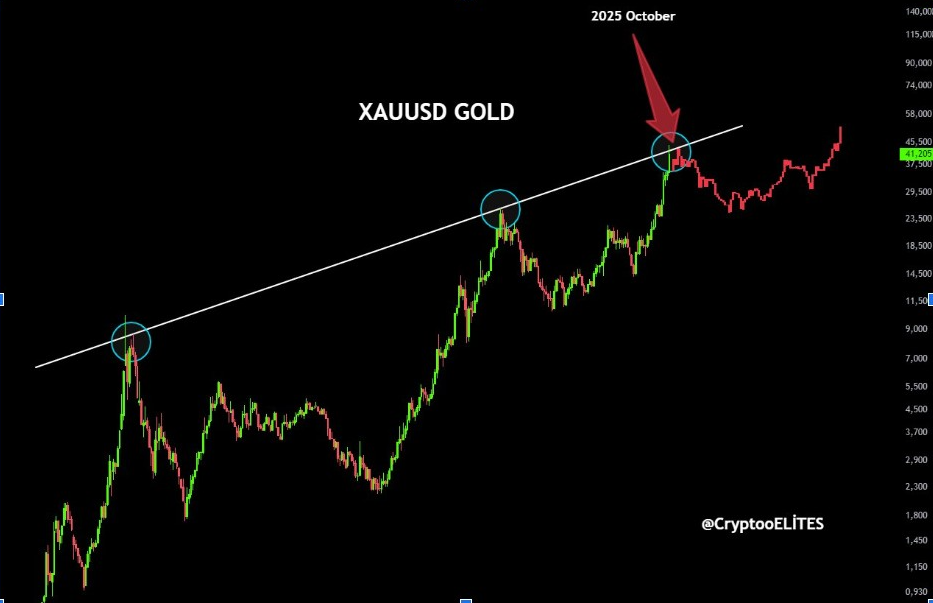
He said gold’s recent breakout above $4,300 could have exhausted the bullish trend for the precious metal. The model indicates that the current structure reflects the previous macro peaks of 2012 and 2020. Based on this outlook, October 2025 might be the final high before a long corrective wave is in place.
The analysis is provided against the backdrop of overall market uncertainties, with traders debating whether gold can continue to serve as an inflation hedge as global liquidity is eased. If the trend continues, Gold price may undergo months of sideways or downwards movement after the recent spike.
Projection of $2,000 Retest Gains Momentum
Another view from Egrag Capital suggests a more profound correction ahead. Their long-term logarithmic chart has gold approaching the $2,000 zone, which is right at the 21-year moving average price. Historically, all major cycles have reached a peak, and valuation retracements have averaged 40-50%, indicating a structural reset for the next period of expansion.
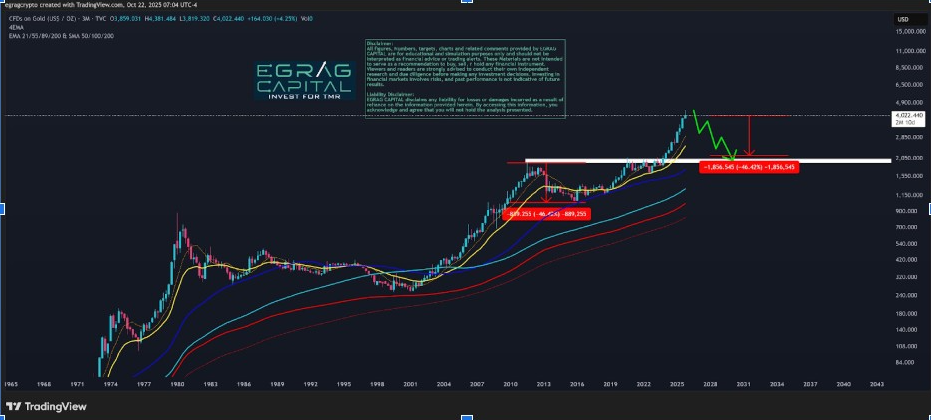
The current projection exhibits the same behavioral pattern, with indicators suggesting a 46% retracement from recent highs. According to the model, this scenario would take Gold price close to the $2,050-$2,100 zone, similar to its consolidation phase between 2020 and 2021.
In his analysis, Egrag pointed out that the parabolic rise in Gold may have exceeded sustainable demand and that a retest is necessary to achieve long-term stability. Once this level is attained, the firm anticipates a gradual bottoming pattern, which has been observed in the past, such as the recovery cycle in the years 2015 and 2018.
Market Bounce Possible After Oversold Touchdown
Analyst Rashad Hajiyev offered a contrasting view that the decline could be close to an end. He observed that gold had touched its two-month rising trendline around $4,005 before rebounding slightly in the Asian session. He called the level an “ideal touchdown,” suggesting a possible short-term floor.
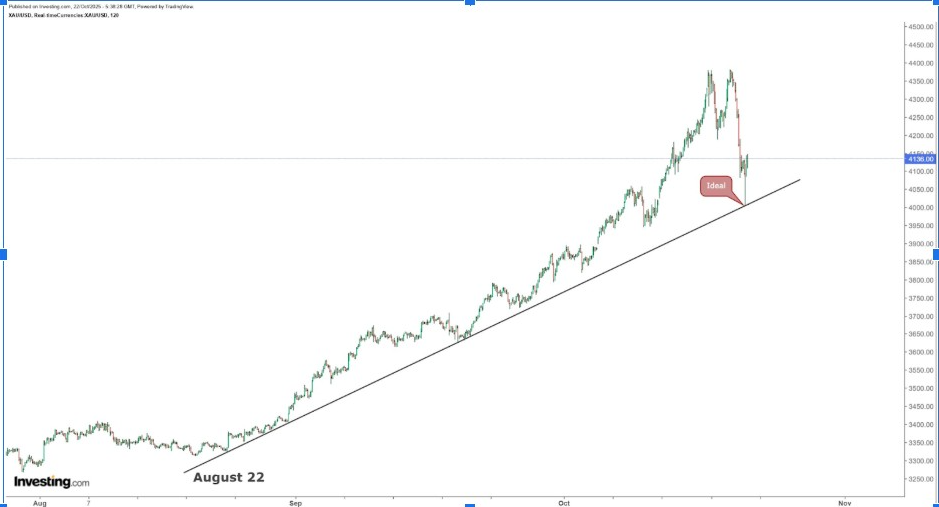
Since late August, Gold has gained almost $1,000 and lost $380 during the recent retracement. Hajiyev believes that a swift correction was necessary to reset market conditions after a prolonged upward trend.
He pointed out how such renewed bullish setups often follow declines, if the trendline support holds. If momentum picks up again, Gold could move towards the $4,800-$5,000 range over the next quarter. Investors will now be watching to see if this bounce represents a reversal or if it will fade under renewed selling.



