
 Dacity Coin
 Pearl
Pearl Monad
Monad Aerodrome Finance
 Pump.fun
 Pudgy Penguins
 NeoSoul
- Shiba Inu (SHIB) is currently trading at $0.00000798 with a rise of -0.25% in the last 24 hours.
- Shiba Inu (SHIB)’s live market cap is $4,703,983,026.
- Shiba Inu (SHIB) faced a rise of -2.23% in the last 7 days.
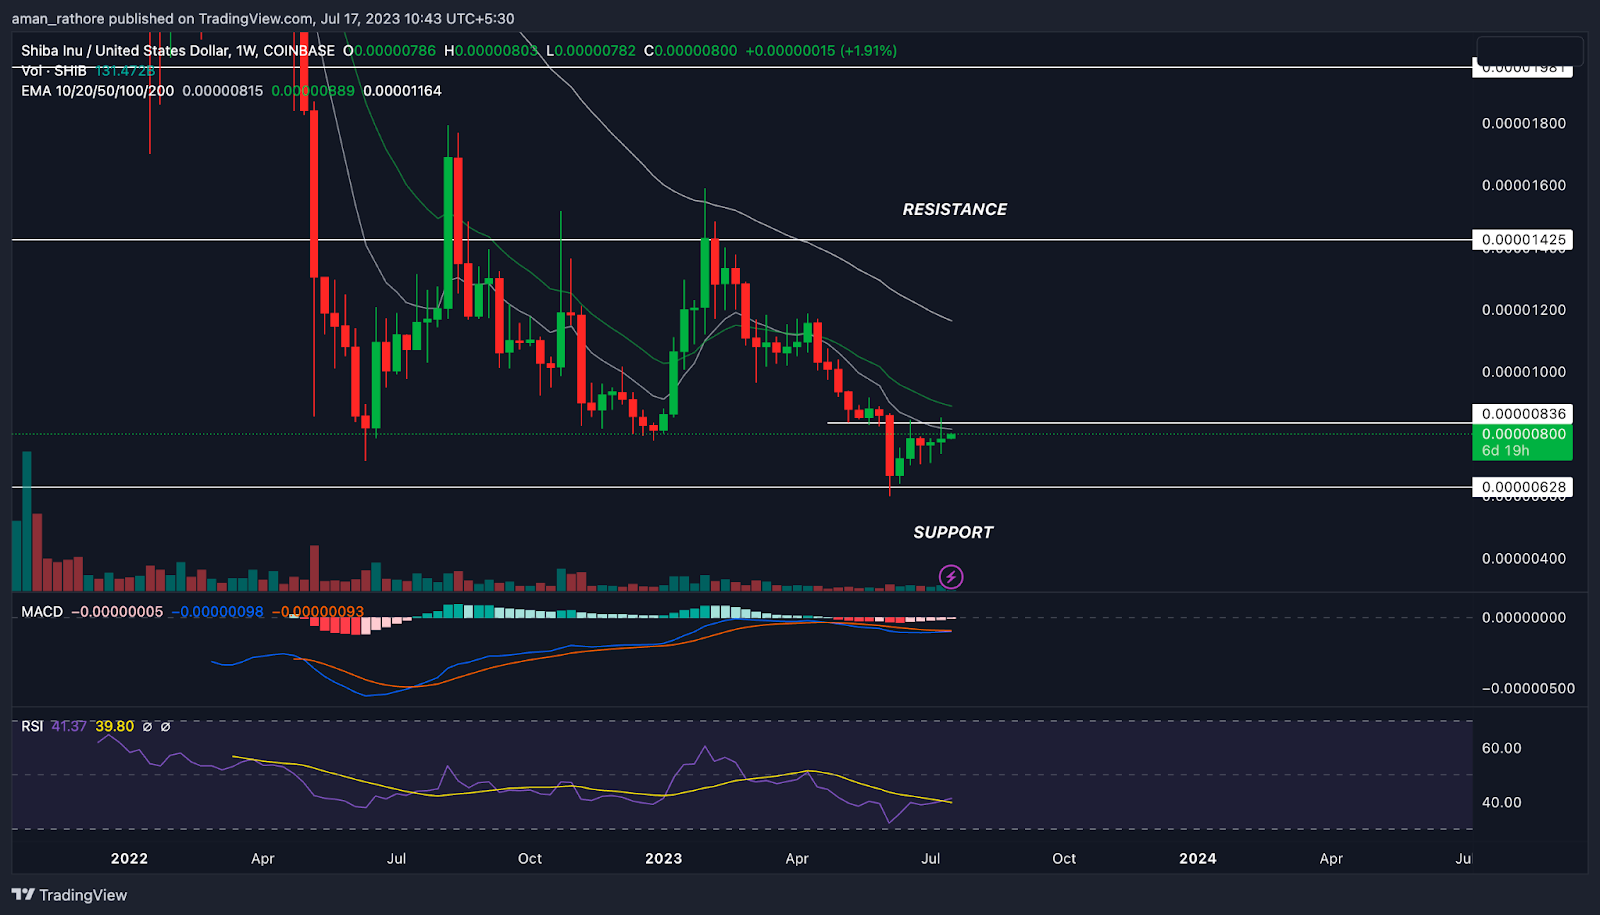
Shiba Inu (SHIB) is currently having an intense downward trend, according to the most recent price trend data. After reaching a high of $6.8824543 last year, SHIB has significantly lost -96.45% of its value. However, the price of SHIB found support at $0.00000628, which resulted in a 42% partial recovery.
Shiba Inu’s (SHIB) price is currently running into resistance around $0.00000836. The price has made several tries to break through this resistance but failed to do so. SHIB’s overall momentum is still bearish and has formed a bearish structure. Notably, the price is presently following a zone pattern, which raises the prospect of additional price drops in the short term.
If the price is able to move over the $0.00000836 range, it can be a sign of an impending upswing. However, it is not suggested to take long positions on Shiba Inu (SHIB) until such a breakout takes place. Before making any investment decisions in the incredibly unpredictable cryptocurrency market, caution must be taken and careful study must be done.
Technical Analysis of SHIBA (1D Daily Timeframe)
EMA
The price of Shiba Inu (SHIB) is currently trading beneath the weekly timeframe’s 20-50 day EMA line, which is a poor sign. Shiba Inu’s (SHIB) stock has been trending downward.
MACD
The MACD indicator helps identify emerging trends, bearish or bullish market conditions, and shifts in momentum. The chart consists of the MACD line, the signal line, and a histogram that displays the deviation between the two lines.
MACD line is currently trading below the daily time frame’s signal line, which denotes a bearish trend. A deteriorating negative trend is shown by red histograms. Shiba’s price may consequently drop even further .
RSI
The weekly time frame’s current value of the RSI is 44.46, and the 14 SMA line is located below the median line. It is getting close to 43.89, which indicates that the market will keep falling.
Volume Analysis
Shiba Inu’s (SHIB) current volume is $91,609,482, with an increase of -58.77% in last 24-hour. This indicates a lack of buyers interest and price may fall in the future.
Conclusion
The technical indicators for the weekly period are currently flashing a bearish signal for Shiba Inu (SHIB), even though the RSI indicates that an overbought scenario is likely and that the price will drop soon. The price of Shiba Inu signals future uncertainty, while the EMA analysis shows a short-term bearish trend.
Technical Levels
Support – Shiba INU’s current support level is $0.00000628.
Resistance – Shiba INU’s current resistance level is $0.00000836.
Disclaimer
The views and opinions of the author, or anyone named in this article, are for informational purposes only. They do not offer financial, investment, or other advice. Investing or trading crypto assets involves the risk of financial loss.




