
 Dacity Coin
 Pearl
Pearl Monad
Monad Aerodrome Finance
 Pump.fun
 Pudgy Penguins
 NeoSoul
- The Curve price is trading at $0.64.
- The Curve (CRV) price is currently trading below the 50-day and 100-day EMA levels.
- Curve (CRV)’s 24-hour volume is $270,210,853 with a decrease of -8.08%.
Curve (CRV)’s price analysis indicates that the price of the Curve is moving in a downward direction, and the price is forming a low-high pattern.
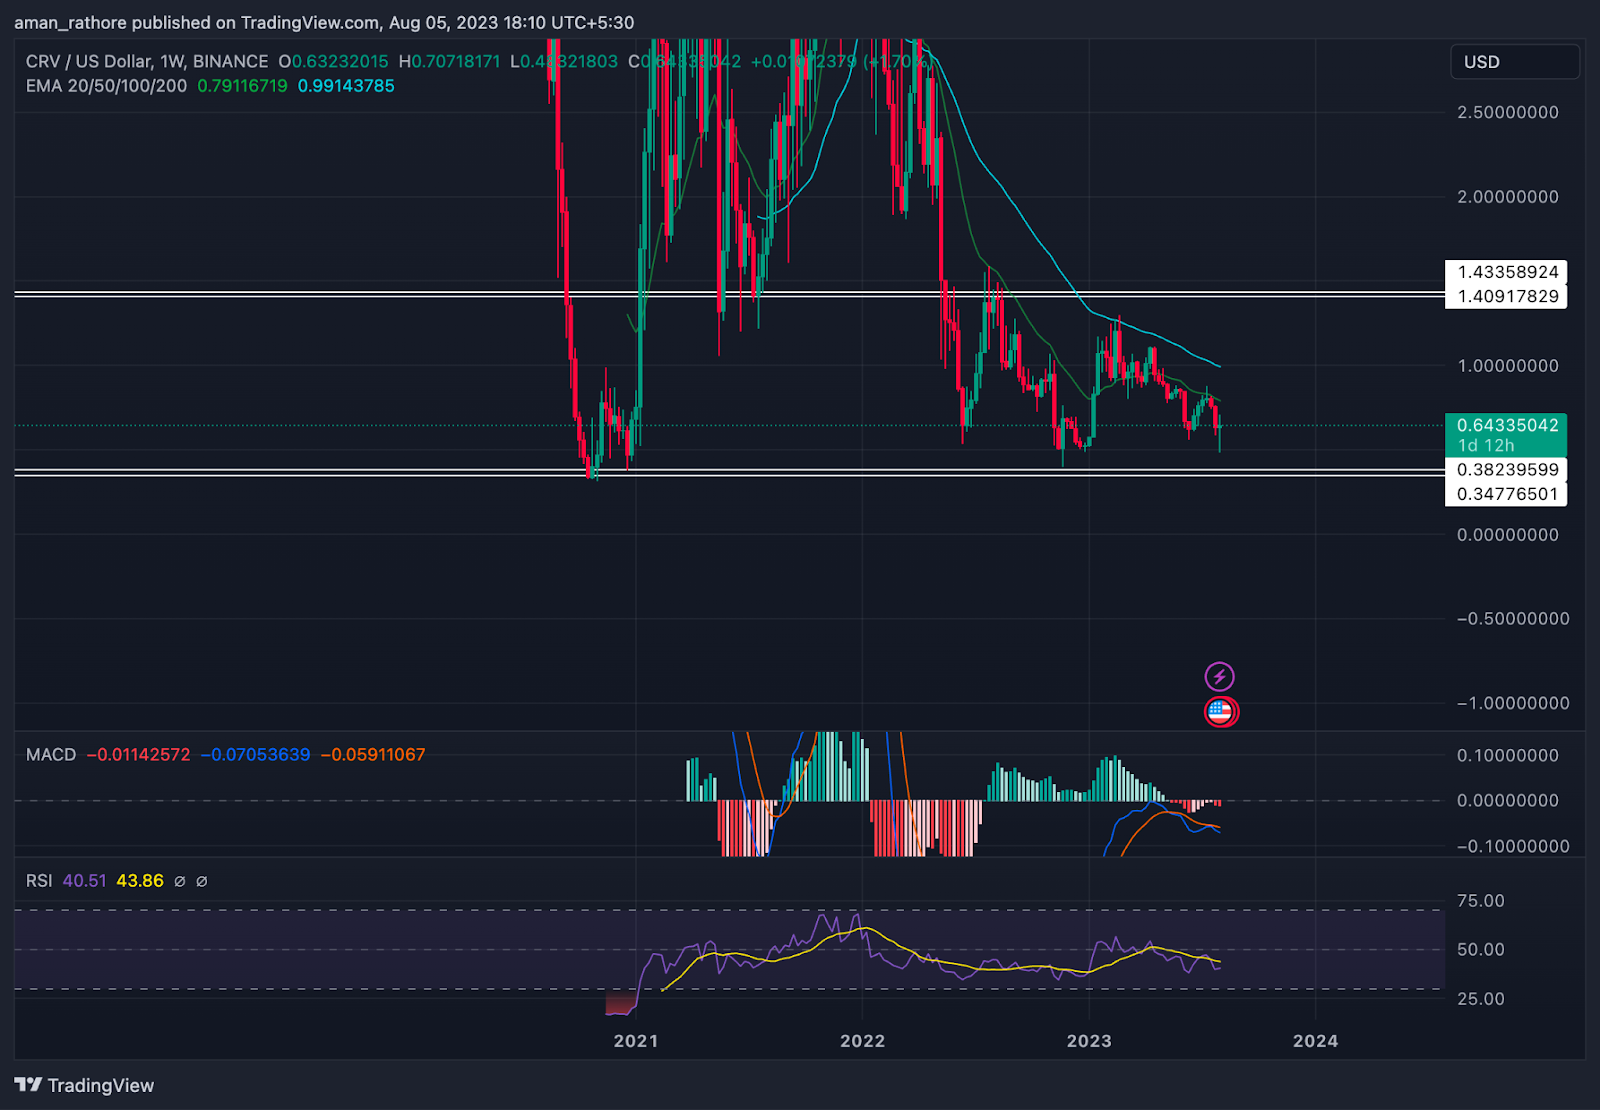
Curve (CRV) is a cryptocurrency that reached its peak value of $6.98 in January 2022, but then it plunged dramatically. In just six months, CRV lost almost 92% of its worth and became one of the worst-performing coins in the market.
After hitting a low of $0.38, the price of Curve bounced back and tried to recover. However, it met strong resistance at the $1.43 level and could not break through.
The price of Curve (CRV) has been moving sideways in a narrow range for more than a year. It has been fluctuating between $0.38 and $1.43, without breaking either level. This shows that the price is in a state of indecision and accumulation.
The weekly timeframe shows a bearish outlook for the Curve (CRV) price. The price may continue to drop as the market sentiment is negative. The volume is also decreasing significantly, which indicates a lack of buying interest. The price may face more downward pressure in the near future.
Curve (BINANCE: CRV) Price Analysis
EMA
On a weekly basis, the price of The Curve (CRV) coin is currently trading below the 50-day, and 200-day EMAs, indicating significant price weakness and the potential for a further decline.
MACD
On a weekly basis, the Curve (CRV) coin’s MACD line is currently below the signal line, presenting a bearish signal and indicating that a price decline is probable in the next few days. The emergence of a red histogram is another sign that a potential price decrease is approaching.
RSI
The current placement of the Curve (CRV), Simple Moving Average (SMA) line is below the RSI line. This raises the possibility of further price falls in the near term.
Conclusion
The price of The Curve (CRV) is currently trading below the EMA level, indicating a negative structure in the price projection. Additionally exhibiting signs of negative momentum are indicators like RSI and MACD. The significant decrease in volume suggests a potential decline in customer interest. Given these factors, it is probable that the CRV’s price will continue to decrease in the near future.
Technical Levels
- Support Levelis- $0.38.
- Resistance Level– $1.43.
Disclaimer
The views and opinions of the author, or anyone named in this article, are for informational purposes only. They do not offer financial, investment, or other advice. Investing or trading crypto assets involves the risk of financial loss.




