
 Dacity Coin
 Celestia
 Pudgy Penguins
 Injective
 Solana
 Sui
Sui Starknet
- The FGP stock price is trading at 144 GBX.
- The company’s stock is currently reflecting bullish sentiment in the chart.
The FirstGroup (LSE: FGP) company was founded on 31 March 1995. It is a multinational transport company that deals in the provision of passenger transport services.
FirstGroup (FGP) Stock: Financial Analysis
The FGP company has been consistent in its revenue report from 2020 to 2022. The company has reported a 6.30% growth in revenue in 2021 and 3.57% in 2022. Only in 2020, the company showed negative growth.
The EPS of the company has been good in 2021 and 2022. The company’s EPS was very low in 2020 in comparison to 2021 and 2022.
FirstGroup (FGP) Stock: Technical Analysis
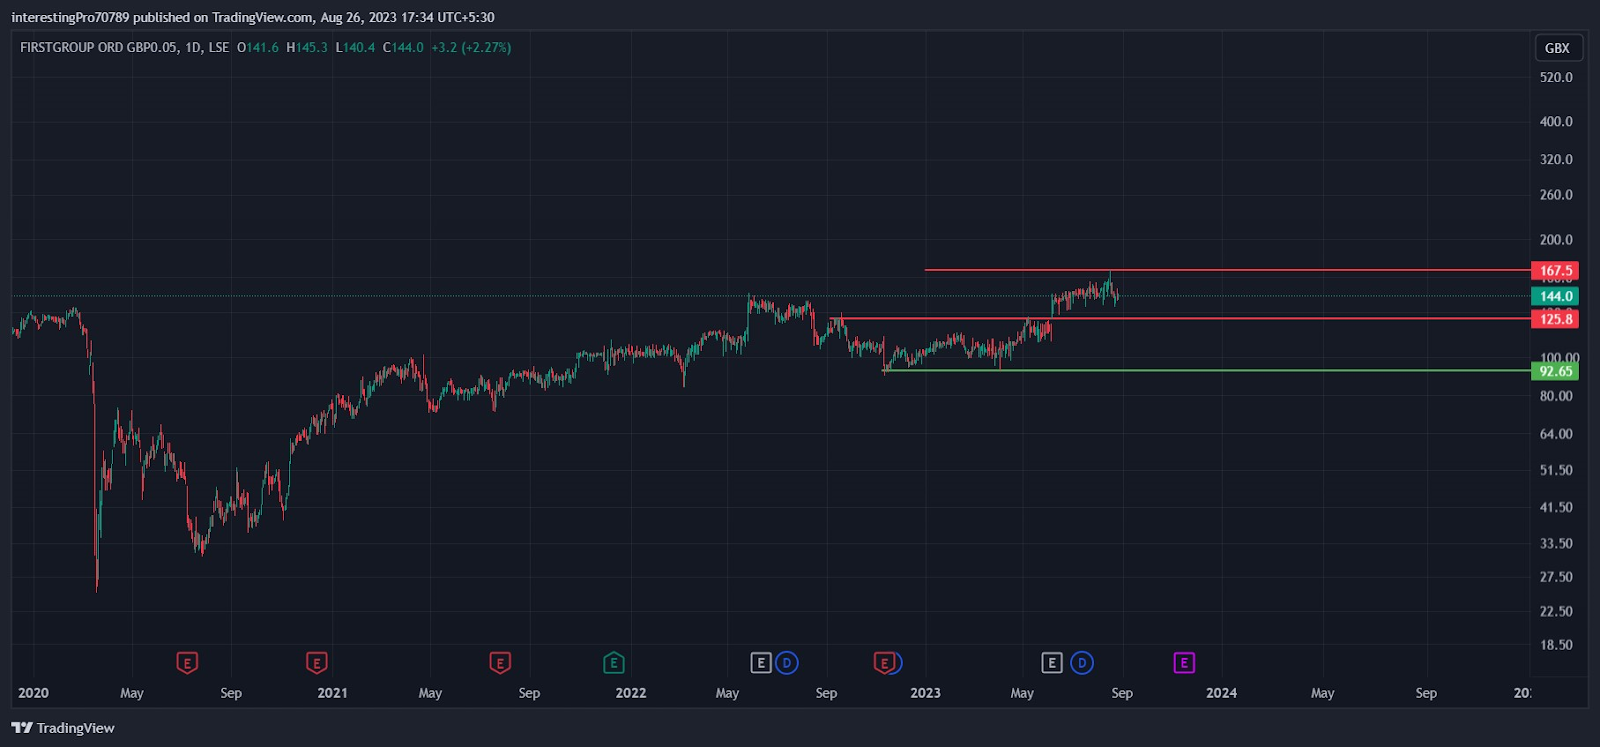
In the year 2020, the FGP price had a heavy fall of more than 80%. The price started to move in the upward direction after that fall. The buyers pushed the price slowly and steadily.
In May 2022, the price managed to recover from the fall and went to 139.9 GBX. It faced rejection from the zone from where it fell in 2020. This time buyers did not let the price fall that much. It went into a consolidation phase for almost 1.5 years. It was facing rejection from the 125.8 GBX.
The price gave a breakout of 125.8 GBX in June 2023 and commenced a bullish rally to 167.5 GBX.
Currently, the price is trading inside a new range of 167.5 GBX (resistance) to 125.8 GBX (support). So, it may take the support at 128.5 GBX because it faced rejection from 167.5 GBX and started to fall. If the price bounces back after taking support at 125.8 GBX, it can rest at 167.5 GBX.
The price will only be in bearish sentiment if it closes below 125.8 GBX and then it can go down to 92.65 GBX.
Technical Indicators’ Prediction About the Current Trend
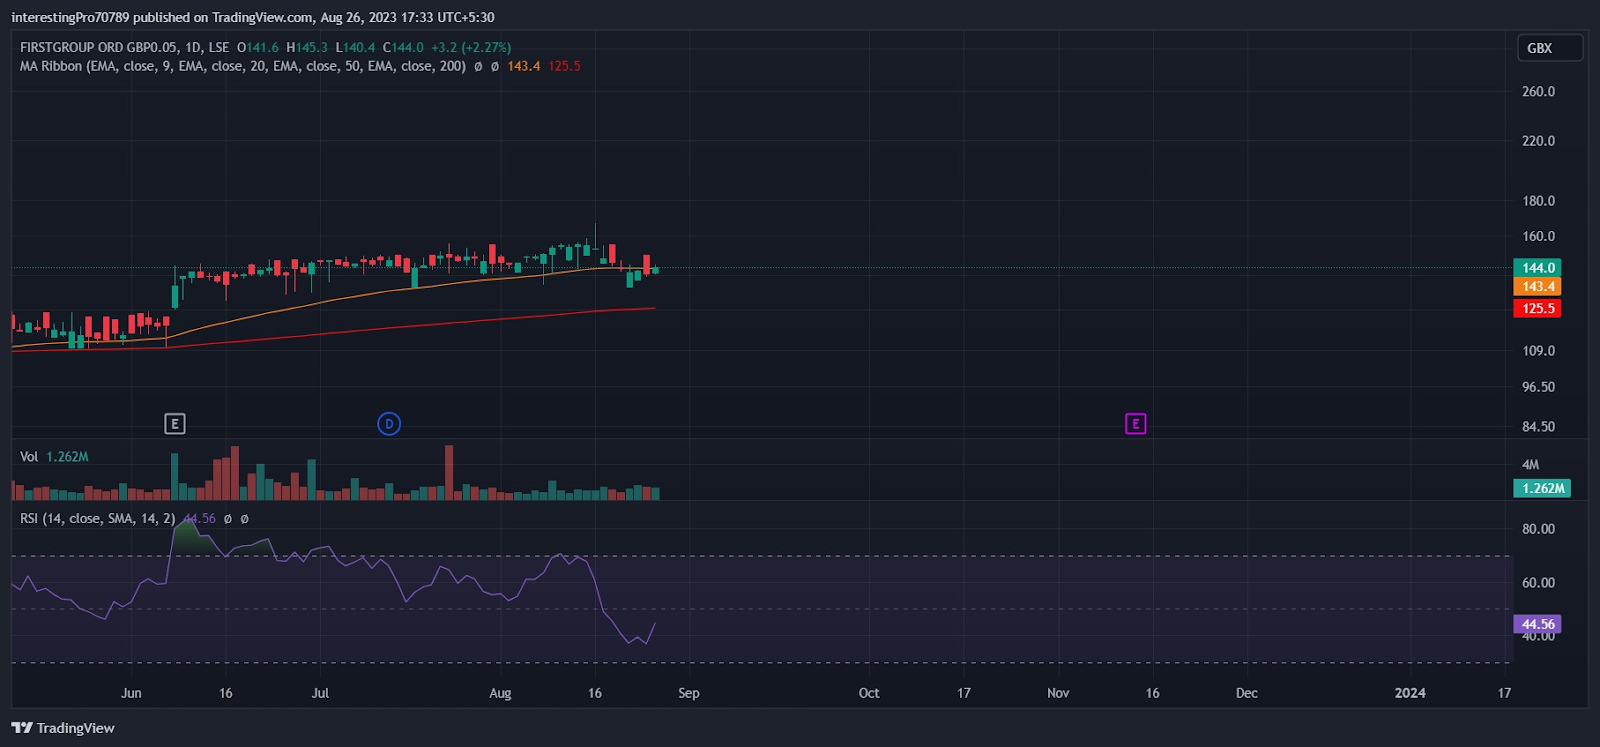
The 50-EMA (yellow line) is at 143.4 GBX and the 200-EMA (red line) is at 125.5 GBX. The FGP stock price is trading between the 50 and 200 EMA. It indicates that FirstGroup Stock price is currently indecisive.
The relative strength index is 44.56. The RSI line is in neutral territory. That indicates the price is currently taking pressure from buyers and sellers.
Conclusion
The overall chart of the FirstGroup is bullish. The FirstGroup Stock price is currently inside a range of 167.5 to 125.8 GBX. The breakout or breakdown of these two levels will decide the further trend of the price. Otherwise, the price will trade only in the given range.
Technical levels
Resistance levels: 167.5 GBX.
Support levels: 125.8 GBX and 92.65 GBX.
Disclaimer
The views and opinions stated by the author, or any people named in this article, are for informational purposes only. They do not establish financial, investment, or other advice. Investing in or trading crypto assets comes with a risk of financial loss.




