
 Dacity Coin
 Pearl
Pearl Monad
Monad Aerodrome Finance
 Pump.fun
 Pudgy Penguins
 NeoSoul
- The MCT coin price has faced a decline of 11.78% in the last 24 hours
- The coin chart price reflects the bear’s hold over the price.
Metacraft coin price has faced a decline of 11.78% and is currently trading at $0.01775 in the last 24 hours at the time of writing. The coins have been trading with a 24-hour trading volume of $39,774.20. The current market capitalization of the coin is valued at $56,182,652, with a circulating supply of 52,661,120 MCT coins.
Metalcraft (MCT) Coin: Technical Analysis
Technical Analysis in a 1-Day Timeframe
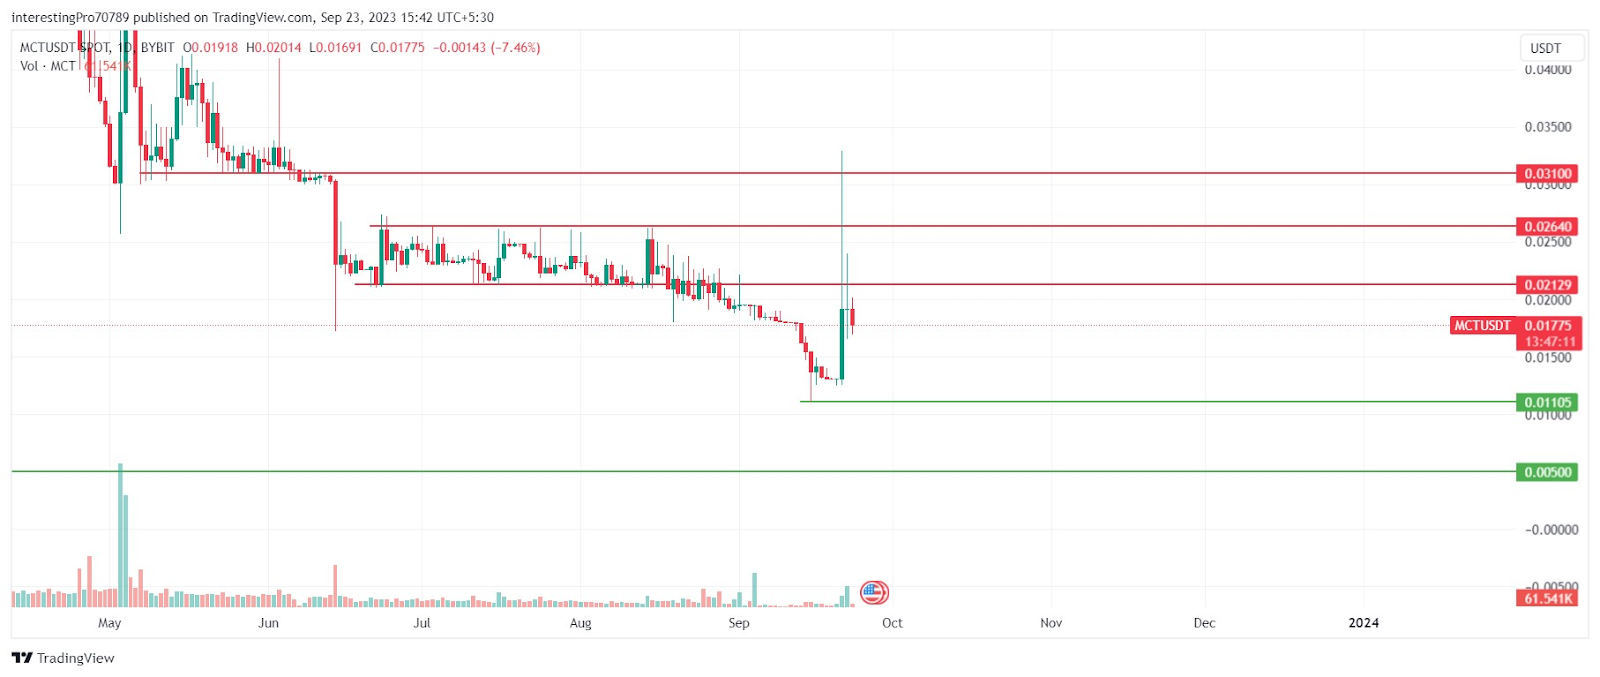
In a 1 day timeframe, the coin price, after falling for 45 straight days from $002129, took support from $0.01105. It recovered from the fall in just six trading days. Recently, the price tried to reclaim the $0.01105 level but failed to do so, and a long-wick candle.
Currently, the price is forming a red candle after facing a rejection of $0.02129. If the price breaks below its recent low of $0.01105, then it will continue its fall and can reach its next support at $0.00500.
However, for the price to be in bullish sentiment, it must reclaim the $0.02129 support and should sustain above it. Then it may rise to its immediate resistance above $0.02640.
Technical Indicator On The Current Trend
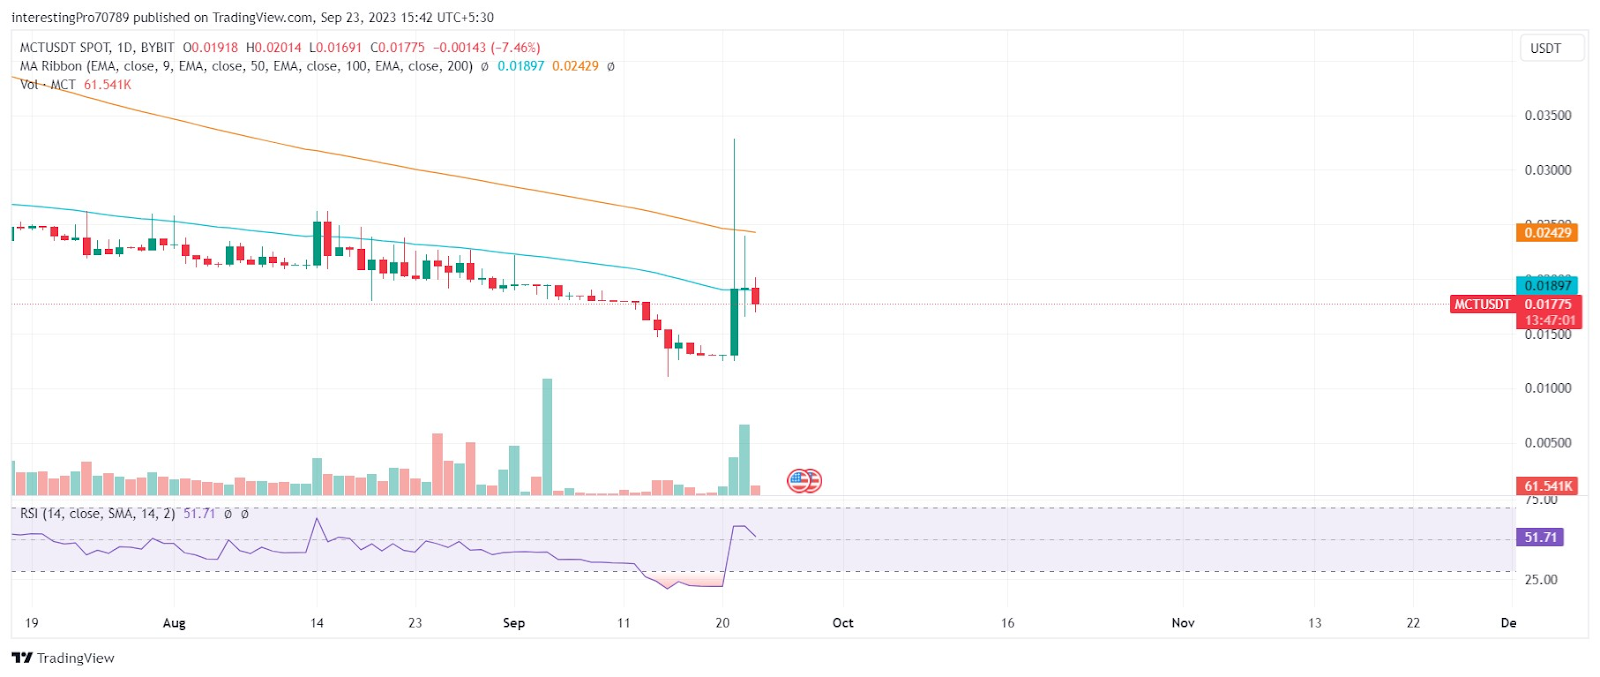
In the last trading session, the MCT price recently faced rejection from the 50 and 100 EMA line. After facing rejection from the EMA line, the price formed a long-wick candle, indicating the seller’s pressure over the price.
The relative strength index has again closed below the 50 RSI level and started to trend in a downward direction. This indicates the seller holds over the price and more for them in the downward direction to make the price fall.
Conclusion
The MCT coin price is bearish at the time of writing. The price is taking a pullback from $0.02129 resistance. The price is currently forming a bearish candle. All the indicators mentioned above point towards the selling pressure and hold of bears over the price. If the price breaks below $0.01105, then it will continue its fall and can reach its next support at $0.00500.
However, for the price to be in bullish sentiment, it must reclaim the $0.02129 support and should sustain above it. Then it may rise to its immediate resistance above $0.02640.
Technical levels
Resistance Levels: $0.02129 and $0.02640.
Support Levels: $0.01105 and $0.00500.
Disclaimer
The views and opinions stated by the author or any other person named in this article are for informational purposes only. They do not provide financial, investment, or other advice. Investing in or trading crypto assets comes with a risk of financial loss.




