
 Quantus
 Injective
 NEAR Protocol
 Sei
Sei Derive
 Bitcoin
 Zcash
Zcash
- MANA token struggles to hold the neutral marks near $0.4500.
- Buyers losing the gains in the last trading sessions.
MANA token shows a bearish engulfing candle, slips from the support mark of $0.5000.Moreover the congestion zone is there where bulls are unable to maintain the gains. However, the recent breakdown drops the token price below the significant moving averages. Moreover, the token is struggling near its demand zone near $0.4200, and buyers are struggling in holding the price near support levels.
Furthermore, the chart showed a rising wedge pattern, which indicates that sellers recently grabbed the grip and moved the price below the buyers range. The pattern’s neckline is $0.4800, below that sellers activate the muscles and bulls lose the strength. However, the token is hovering near the lower Bollinger band, but holding the gain. The price action shows that the token has faced rejection and reverted from the 20-day EMA and is lacking strength along with losing the gains.
When writing. MANA token is trading at $0.4450 with an intraday dip of 4.80%. Moreover, the pair of MANA/BTC is at 0.0002530 satoshis. The intraday trading volume surges by 7.40%.
Daily Charts Shows Congestion Range of MANA
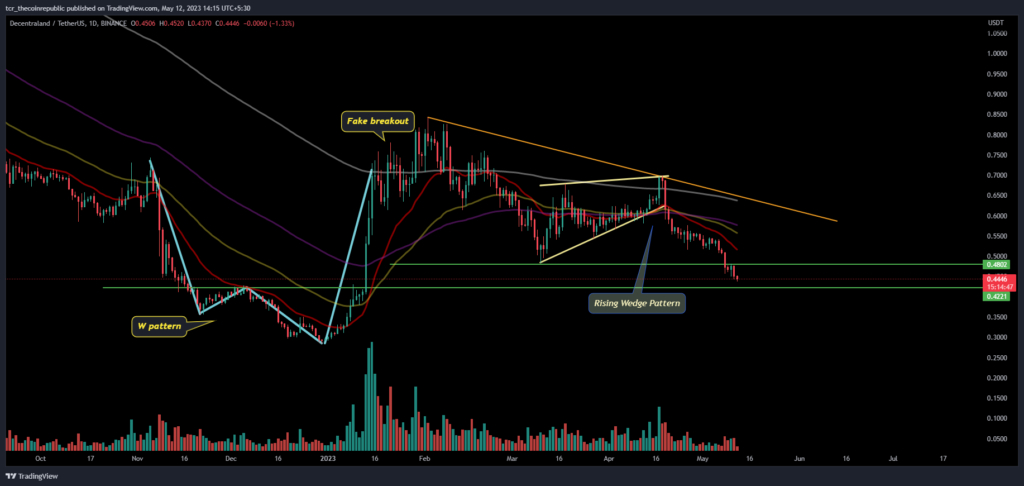
On the daily chart, MANA token is trading below the neutral marks, but trying to hold the gains and willing to regain the strength. MANA stuck in the middle of the congestion range between the mark of $0.4500 – $0.4700 and tried to attain and meet the 20-day EMA. If the token stays in the range, then bulls will activate the muscles in the upcoming days and raise the price to fetch the neckline near $6.50.
Short Term Charts Shows Breakdown
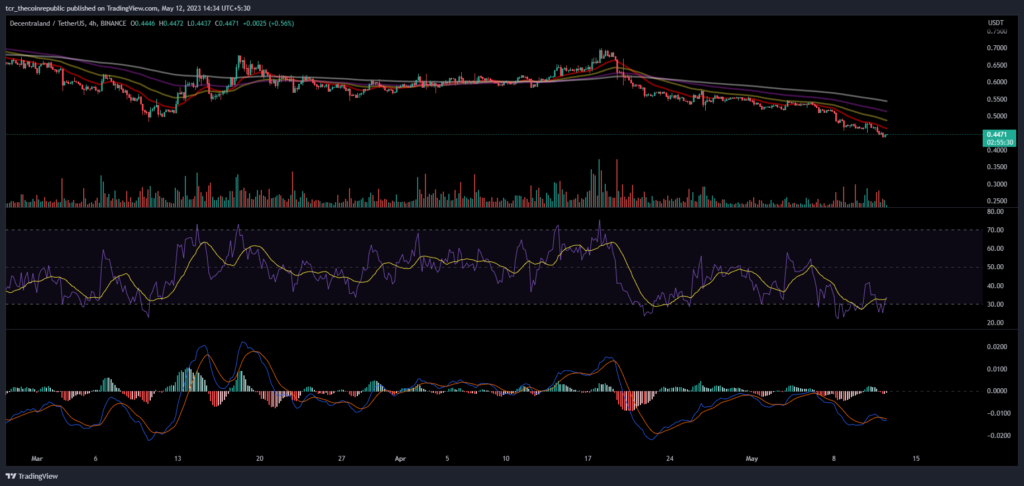
On the 4 hour charts, MANA token breaks the immediate support mark of $0.4500 and slips below the 20 day EMA which becomes buyers trapped.
MANA token shows that the price is ready to show a bounce as positive outlooks are noticed on the chart. The bulls are trying to attain gains, and MANA is trading on the verge of the lower Bollinger band. The RSI curve is near 30, but showed a positive crossover which signals that buyers are willing to attempt to bounce from the oversold region to gain momentum and deliver gains.
The MACD curve is showing convergence of both the moving averages and does not suggest any clear indications. Moreover, the signal curves are not in the favour of buyers in comparison to sellers. Sellers are dominating in the last trading sessions with lower trading volumes.
Conclusion:
MANA token shows that the price is ready to show a bounce as positive outlooks are noticed on the chart.
Technical Levels:
Support Levels: $0.400
Resistance Levels: $0.4800 and $0.500
Disclaimer
The views and opinions stated by the author, or any people named in this article, are for informational purposes only and do not establish financial, investment, or other advice. Investing in or trading crypto assets comes with a risk of financial loss.




