
 Injective
 Bitcoin
 Quantus
 Sui
Sui Derive
 Pump.fun
 Quant
Quant
- Polkadot Price defends $5.00 but confirmation of reversal is awaited.
- DOT Price rejected the 200 day EMA and dropped below $50 day EMA.
- Polkadot Price prediction suggests a rise till it sustains above $5.00 support.
Polkadot Price struggles to defend the crucial support at $5.00 and buyers are trying to reverse the trend. DOT Price corrected 25% approx from the recent swing high and slipped down by forming lower low swings.
Polkadot Price rejected the 200 day EMA and also dropped below the 50 day EMA showcase positional trend is in the downward direction. However, the Polkadot crypto price is near the demand zone and buyers will try their best to defend it.
Polkadot Price is trading at $5.403 with an intraday decline of -1.10%. The 24 hour volume to market cap ratio is 0.0269. The pair of DOT/BTC is trading at 0.0001965 with an intraday decline of -0.71%.
The chart structure of DOT with BTC is in a strong downtrend and hitting the yearly lows. It indicates sellers are more active in DOT/BTC pair as compared to the USDT pair. At the mid of March, The price of Polkadot with BTC pair broke down the crucial support of 0.0002600.
It hurted the sentiment of investors and they choose to exit on higher levels. However, the DOT/USDT pair prices took support near $5.00 and began to rise in upward direction. The rally continued and hit a high at 7.00. Later, the overall market sentiment turned mild bearish which negatively impacted and prices witnessed profit booking.
Will Polkadot Price recover from crucial support?
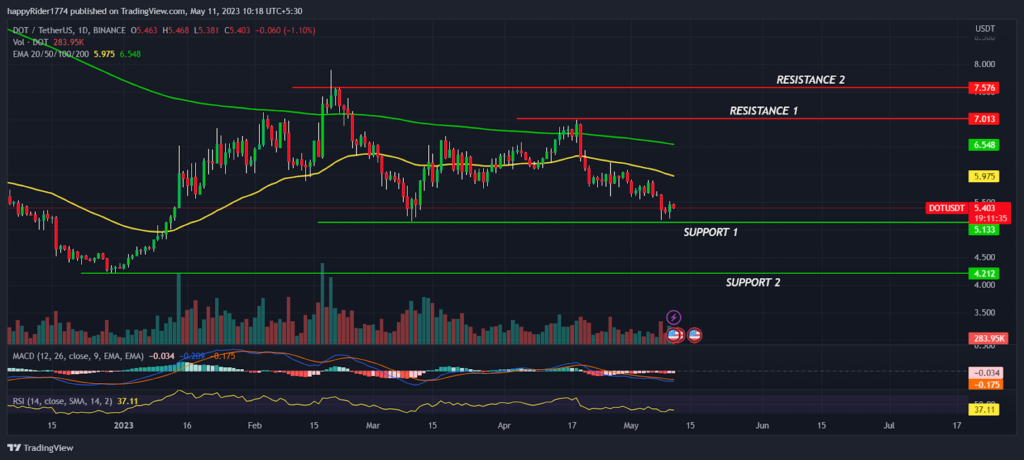
Polkadot Price prediction favors the bulls and suggests a rise in the long term till it sustains $5.00 support. DOT price is quite volatile but consolidating in a wide range $5.00 to $7.00 and likely to break either side soon.
If buyers succeed to defend the $5.00 and the possibility of rebound will remain high in favor of bulls. However, the price will turn bullish and pick up momentum when it breakout of the $7.00 hurdle.
On the other hand if DOT price dropped below the $5.00 then bears will try to drag it down to the yearly lows. The technical analysis suggests, DOT price is in short term correction mode and downfall is likely to take halt near the support zone.
DOT price eroded the previous gains
DOT price formed a bearish candle on a weekly timeframe and eroded the gains of past few months. If the crypto market leader Bitcoin Price recovers then it might positively impact the prices of other Altcoins.
Else Polkadot Price will remain in a wide range mentioned in the chart. The technical indicators like MACD had generated negative crossover but the curve is reversing sideways. It indicates bears lacking the downside momentum. The RSI at 36 denotes an oversold zone and relief rally may trigger any time from lower levels.
Conclusion
Polkadot Price struggles to defend the crucial support of $5.00 and buyers trying to reverse the trend. However, the confirmation of trend reversal will come when buyers succeed to climb above the 200 day EMA. The technical analysis suggests, DOT price is in correction mode and downfall is likely to take halt near the support zone.
Technical levels
Resistance levels : $7.000 and $7.200
Support levels : $5.000 and $4.200
Disclaimer
The views and opinions stated by the author, or any people named in this article, are for informational purposes only. They do not establish financial, investment, or other advice. Investing in or trading crypto assets comes with a risk of financial loss.




