
 Zerebro
 Bitcoin
 Quantus
 Pearl
Pearl Starknet
 ZKsync
 NEAR Protocol

Key Insights:
- Whale bought 26,255 ETH worth $60M amid $2,500 drop.
- Another bought 17,070 ETH for $39M post-crash, now holds $303 M.
- Over $99M in ETH accumulated while retail panic sold cheap.
Ethereum price (ETH) has dropped by 10% in the last 24 hours, continuing its recent bearish trend in the market. The cryptocurrency is now trading below the key support level of $2,200, raising concerns among investors. The downward pressure signals increased selling activity as bearish sentiment appears to be gaining momentum.
Whales Accumulate $99M ETH Amid Market Panic
The whale action in the crypto market has taken off, as not one, but two huge Ethereum purchases were reported in the news in a matter of hours.
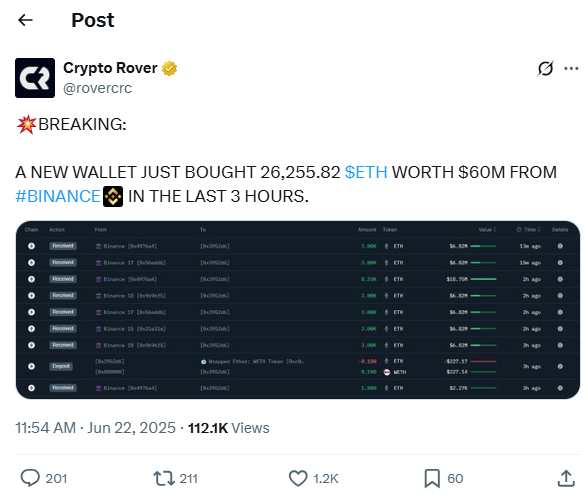
It is also said that a new wallet has just bought 26,255.82 ETH worth 60 million dollars. These exchanges were made within only three hours and were carried out through Binance, which is one of the most massive universal crypto exchanges in the world.
Blockchain information shows various transactions with an average of 2,200 ETH per transaction. When making the purchases, the ETH prices per transaction were fluctuating at a level of between $2,278 and $2,320. Strategic acquisitions are under the suspicion of the analysts when the prices fell, which may be perhaps after the recent market adjustment.
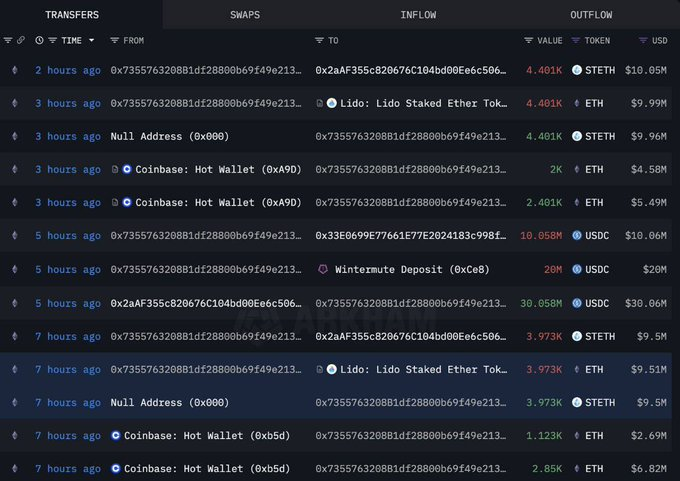
Meanwhile, another established whale made headlines for adding 17,070 ETH to their holdings. The purchase, worth approximately $39 million, was executed following the market downturn. This acquisition brought the whale’s total Ethereum stash to 132,536 ETH, now estimated at over $303 million in value.
Ethereum Price Nears Crucial Weekly Chart Breakout
One crypto analyst has pointed to an important technical moment in the Ethereum price as it reaches a critical decision point on the weekly chart. In the last seven weeks, the ETH has been stuck in the range between the 50 and 200-week moving averages, which is seen as a sign of confusion on the part of traders.
This small trading range is normally followed by a big move and now with the price action we see an ETH getting ready to break below support.
Melker emphasized that the weekly close will act as a critical pointer to the next trend of ETH. The possibility that a confirmed close will be below 200-weeks moving average may create bearish inclination and further sell-offs.
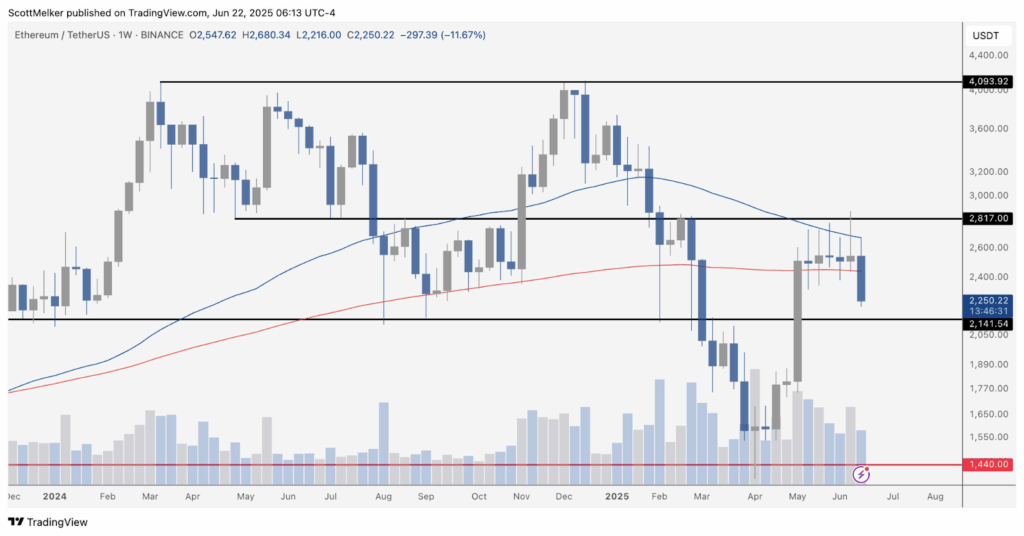
Conversely, the reclaiming of the 50-week moving average would be a sign of strength and reinforce bullish differing. The people trading and investing are now attaching importance to weekly close and more or less it may determine the progress of ETH over the next few weeks.
Will ETH Price Recover Soon?
The ETH price traded at $2,194 at press time, attempting to rebound after falling inside a defined descending channel.
Over the past few sessions, Ethereum has respected the channel’s upper and lower bounds, signaling strong short-term bearish pressure. The market’s ability to stay above the $2,100 support zone is now in focus.
Technical indicators confirm recent bearish sentiment but hint at a potential turnaround. The RSI stands at 23.29, deep in oversold territory, suggesting that selling momentum may be exhausting. Such conditions often precede short-term relief rallies or trend reversals.
Meanwhile, the MACD indicator shows signs of weakness in bearish momentum. Though the histogram remains below zero, its bars are shrinking, indicating reduced selling strength. The MACD line at -81.51 remains under the signal line, but traders will watch for a possible crossover in the coming sessions.
Price action remains critical around the $2,100 support level. A sustained hold above it could trigger a test of the $2,300 resistance. If buyers manage to break out of the descending channel convincingly, further upside towards $2,500 may become realistic.
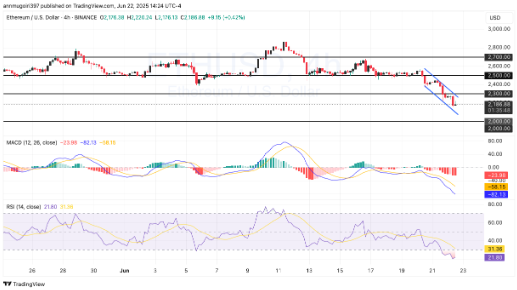
However, failure to hold above $2,100 could open the door to a retest of $2,000, a psychological and technical support level.
Disclaimer
This article is for informational purposes only and provides no financial, investment, or other advice. The author or any people mentioned in this article are not responsible for any financial loss that may occur from investing in or trading. Please do your research before making any financial decisions.




