
 streamoors
 IGNITION
 no crying in the casino
 Sword Inu
 Altai the Tiger
 NEAR Protocol
 Quantus

The MSTR stock price remained in a freefall this week as Bitcoin plunged below $105,000 for the first time in weeks. Strategy shares also plunged as woes in the Bitcoin treasury industry mounted, with more companies losing their premiums.
Strategy stock was trading at $280, down sharply from the year-to-date high of $457 and its all-time high of $540.
Technical Analysis Suggests that the MSTR Stock Price May Plunge to $230
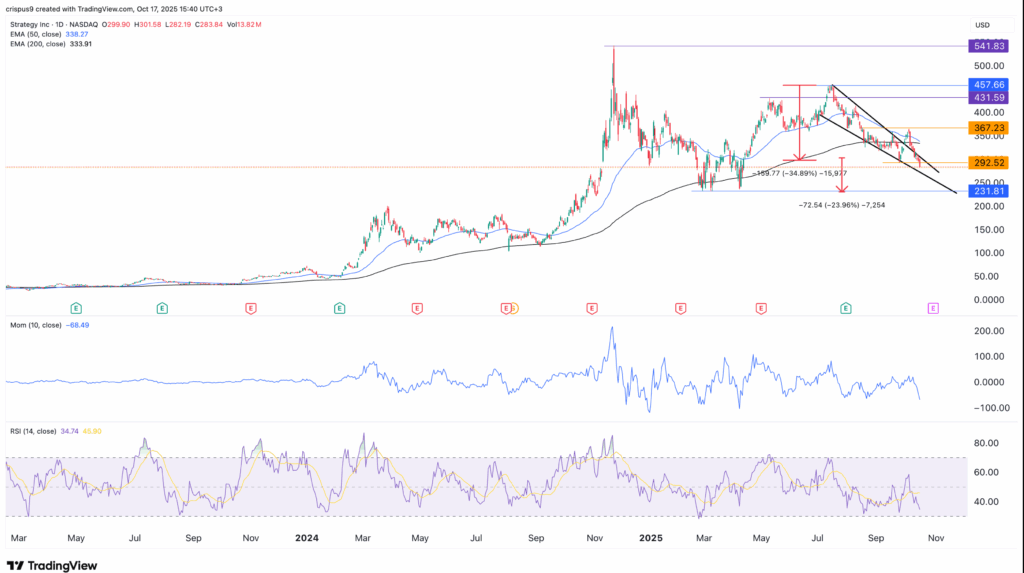
The daily timeframe chart shows that the MSTR share price has collapsed after peaking at $457 in July this year. This plunge has coincided with the performance of other Bitcoin treasury companies like Metaplanet, MicroCloud Hologram, and Semler Scientific.
The stock has now invalidated the forming falling wedge chart pattern, which is made up of two falling and converging trendlines. In most cases, this pattern is one of the most common bullish patterns in technical analysis.
The stock is now about to form the highly bearish death cross pattern, which happens when the 50-day and 200-day Exponential Moving Average (EMA) cross each other. This pattern normally confirms that bears are in control and often leads to more downside. It will be the first time that the company has formed a death cross since it started its Bitcoin accumulation strategy.
Other technicals suggest that the MSTR stock has more downside in the near term. For example, the momentum indicator has drifted downwards, while the Relative Strength Index is falling and is nearing the oversold level.
Therefore, the most likely scenario is where the stock plunges and possibly reaches the important support level at $230, its lowest level in February and April this year.
On the flip side, a jump above the psychological level at $250 will invalidate the bearish MSTR stock forecast.
Strategy Stock Plunged to Accelerate as Bitcoin Plunges
The main catalyst for the ongoing MSTR stock price is that Bitcoin price has been in a strong downward trend in the past few weeks. BTC has plummeted from its year-to-date high of $126,200 earlier this month to its current level of $105,000.
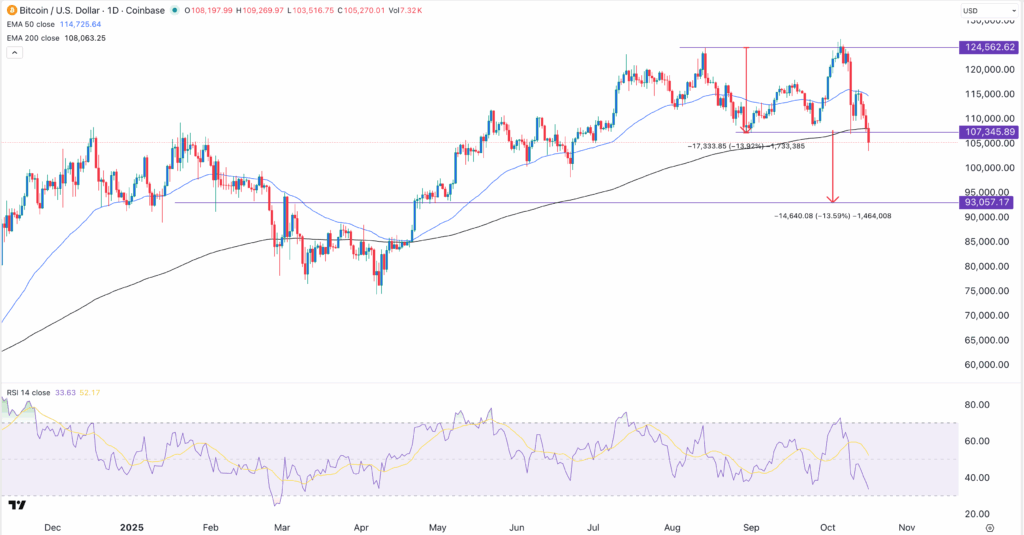
A closer look at the chart below reveals that the crash is expected to accelerate in the coming weeks. It has formed a double-top pattern and has now moved below the neckline at $107,697, its lowest level in August.
The distance between the double top and the neckline is approximately 13%. Measuring the same distance from the neckline at $107,345 means that the coin may crash to $93,000.
The bearish view is also based on the fact that the Bitcoin price has crashed below the 50-day and 200-day Exponential Moving Averages, a sign that bears remain in control.
Bitcoin Impacts the MicroStrategy Stock
A crashing Bitcoin price has benefits and cons for Strategy. The only benefit is that it makes the coin cheaper as the company continues its accumulation strategy. For example, it can now buy more coins than when Bitcoin was trading at a record high of over $126,300.
However, the falling Bitcoin price means that its assets are declining as well. It now has 640,250 coins worth $67.5 billion in its balance sheet. At its all-time high of $126,300, these coins would be worth over $80.8 billion.
Additionally, the declining BTC price indicates that the premium the company had a few months ago has largely disappeared. The mNNAV has dropped to 1.197, while the mNAV based on the enterprise value has been in a strong downward trend to 1.4.
Therefore, there is a likelihood that the company will find it difficult to raise capital to accumulate Bitcoin. In fact, recent data shows that it has mostly relied on share sales to raise capital as demand for its preferred equity has waned.
The falling Bitcoin price, its weak technicals, and the falling mNAV multiple means that the stock will continue falling.




