streamoors
 IGNITION
 no crying in the casino
 Sword Inu
 Altai the Tiger
 NEAR Protocol
 Quantus

Dogecoin price received fresh attention after it passed a major regulatory milestone on Nasdaq. Momentum was on the side of the trend with several different types of technical signals indicating potential exhaustion of the trend. Traders are now keeping a check to see if these developments can have an impact on the Dogecoin price in the coming sessions.
Dogecoin price Jumps as Nasdaq Clears 21Shares ETF
Dogecoin got a major boost after Nasdaq approved the 21Shares 2x Long Dogecoin ETF. The approval was made via an official regulatory notice signed by Nasdaq’s own regulatory operations head.
The document was used to confirm receipt and acceptance of the ETF registration under Form 8-A 12(b). Dogegod shared the update, noting the product could launch next week once final procedures are complete.
The development gives Dogecoin its first leveraged ETF listing on a major U.S. exchange. Market participants are looking forward to higher liquidity once the product becomes available. The approval reinforces the institutional strength of the asset in view of the next cycle.
Traders see the announcement as a structural shift that could affect sentiment. Momentum may continue further as the price reacts positively to the upcoming launch window.
Daily Chart Shows Bullish Divergence
Notably, a bullish divergence formed again on the daily chart of Dogecoin. Trader Tardigrade pointed at the divergence between price and RSI, which was earlier marking the trend reversals.
His chart showed repeat cases where falling prices coincided with rising RSI and often saw prolonged downtrends end. The latest pattern is similar to previous phases in mid-2023 and in early 2025.
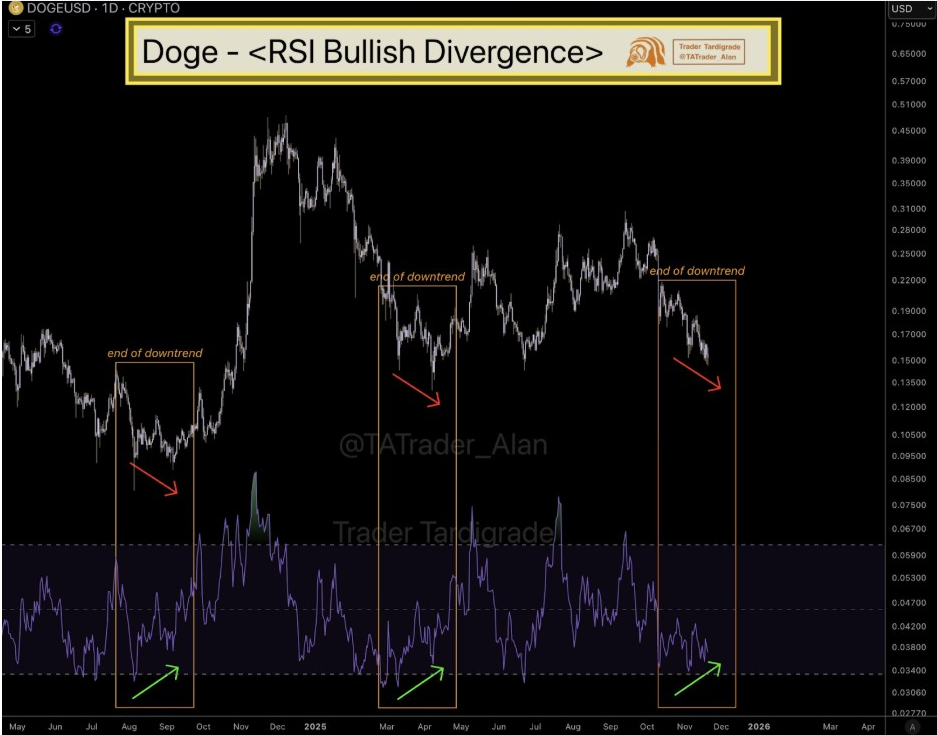
RSI now shows upward movement while price forms new lows. This structure historically triggered waves of recovery to higher resistance zones. The indicator showed that sellers are potentially losing strength.
If the divergence holds, the top memecoin may try to rebound from recent lows. Traders are seeking confirmation that momentum is being sustained with a strong daily close above short-term resistance levels.
Short-Term Double Bottom Emerges
Furthermore, a bullish structure also occurred on the lower-timeframe chart. Trader Tardigrade spotted a double bottom forming on the two-hour structure. His chart has two matching lows near the $0.145 area. Price now tries to fight its way to the neckline around $0.158.
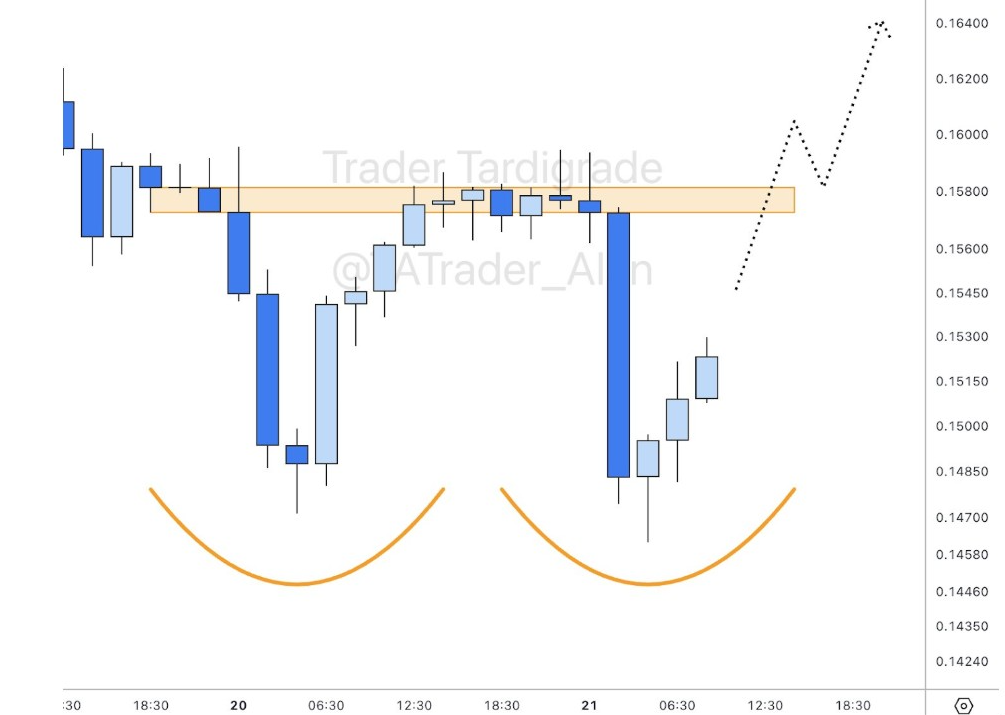
If Dogecoin price breaks the neckline with strong volume, a continuation pattern could be in place. The breakout could be aimed at short-term levels around $0.164 and $0.17.
The formation is a classic intraday reversal structure. Traders see the pattern as early confirmation of a strengthening demand. The setup becomes invalid when the price goes below the double bottom lows.
Weekly Trendline Signals Key Support
Meanwhile, broader analysis revealed that Dogecoin price is retesting historical trends. Altcoin Piooners pointed out that DOGE price broke a 2-year descending structure before retesting it as support.
Their chart showed that the price oscillated between $0.142 and $0.148 with high volume activity. Going above $0.145 could lead to a move towards $0.26, according to analysts.
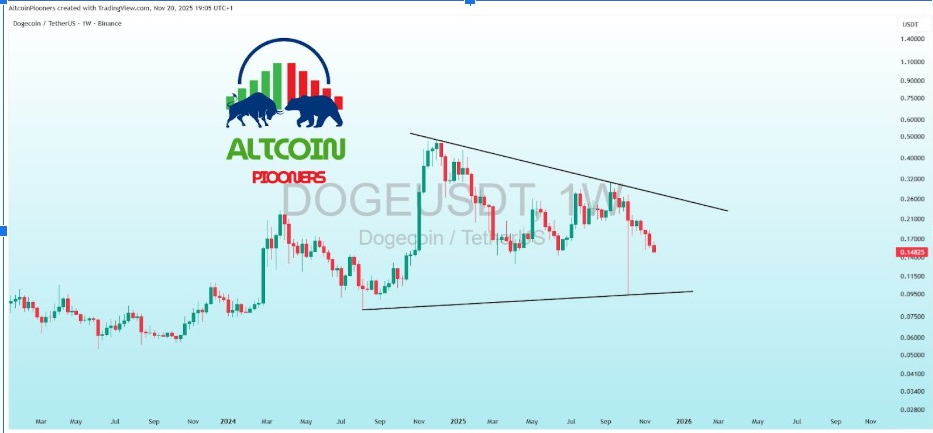
They also called a weekly close above $0.18 a major bullish call. RSI recently broke a multi-year time frame trend line on its higher time frame chart.
MACD also showed indications of a possible golden cross. Volume is at the highest level since the peak in 2021. They believed the top memecoin is making a higher low in the context of a larger wedge.
Further support analysis comes from CryptoPulse, which traces Dogecoin’s longer trendline. His weekly chart shows price slipping below a multi-year ascending support. He said the breakdown makes the trend bearish until reclaimed. To rebound, the price must close above $0.17.
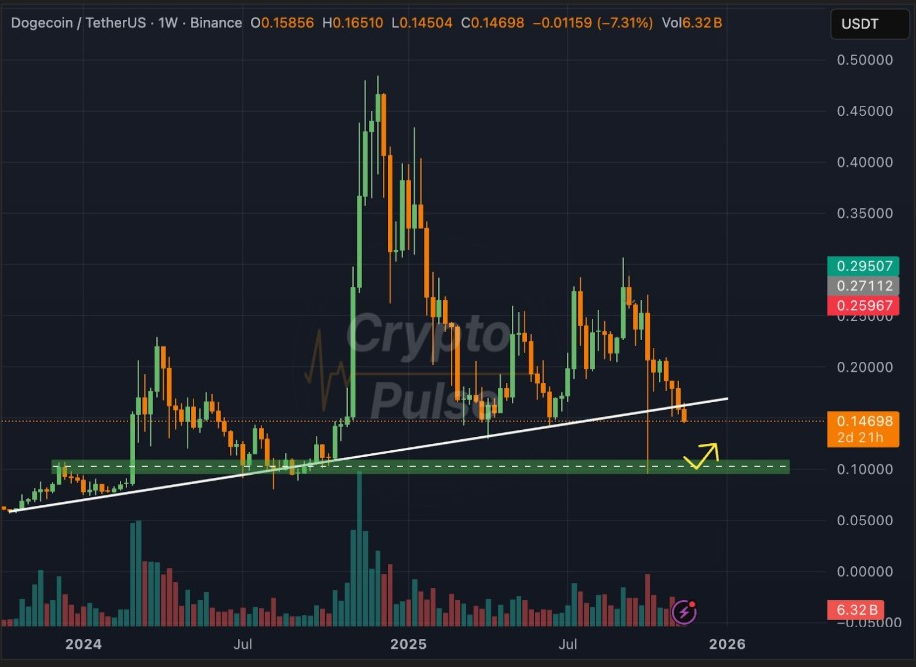
He identified $0.10 as the next major weekly support. The zone has been known for producing strong reactions. He went on to say there was previously an aggressive return of demand during tests of this region.
Traders focus on the level being important if selling prevails. CryptoPulse said buyers have to anchor the price above this zone to avoid deeper losses.