
 IGNITION
 streamoors
 Injective
 NEAR Protocol
 Pearl
Pearl LayerZero
 Quantus
Key Insights:
- Liquidity above $2.00 signals growing pressure for a breakout.
- Open interest stays elevated despite XRP’s recent price consolidation.
- XRP price must clear resistance near $2.30 to gain momentum.
Markets have demonstrated strong XRP price and positioning in the last 24 hours. They are now aiming towards the price point above $2.00 again.
Liquidity clusters have formed on both sides of the current price range. Technical indicators, futures data, and volume trends are aligning. Together, they suggest that near-term volatility is likely to increase.
XRP Price Heatmap Signals Intensifying Liquidity Clusters and Breakout Potential
Studying the 4-hour order book heatmap, we find large resting liquidity areas around 1.87, a short-term price magnet. In recent sessions, this zone has enjoyed aggressive sell-side attention.
XRP price has been in a broader 7-month consolidation phase. When its price briefly dipped into a key area, buyers quickly absorbed it. This rapid demand led to a strong bounce in price.
Market traders are looking at the liquidity chasm in the $1.72 area. This is a potential blessing entry, although this retreat is not evident per the present momentum.
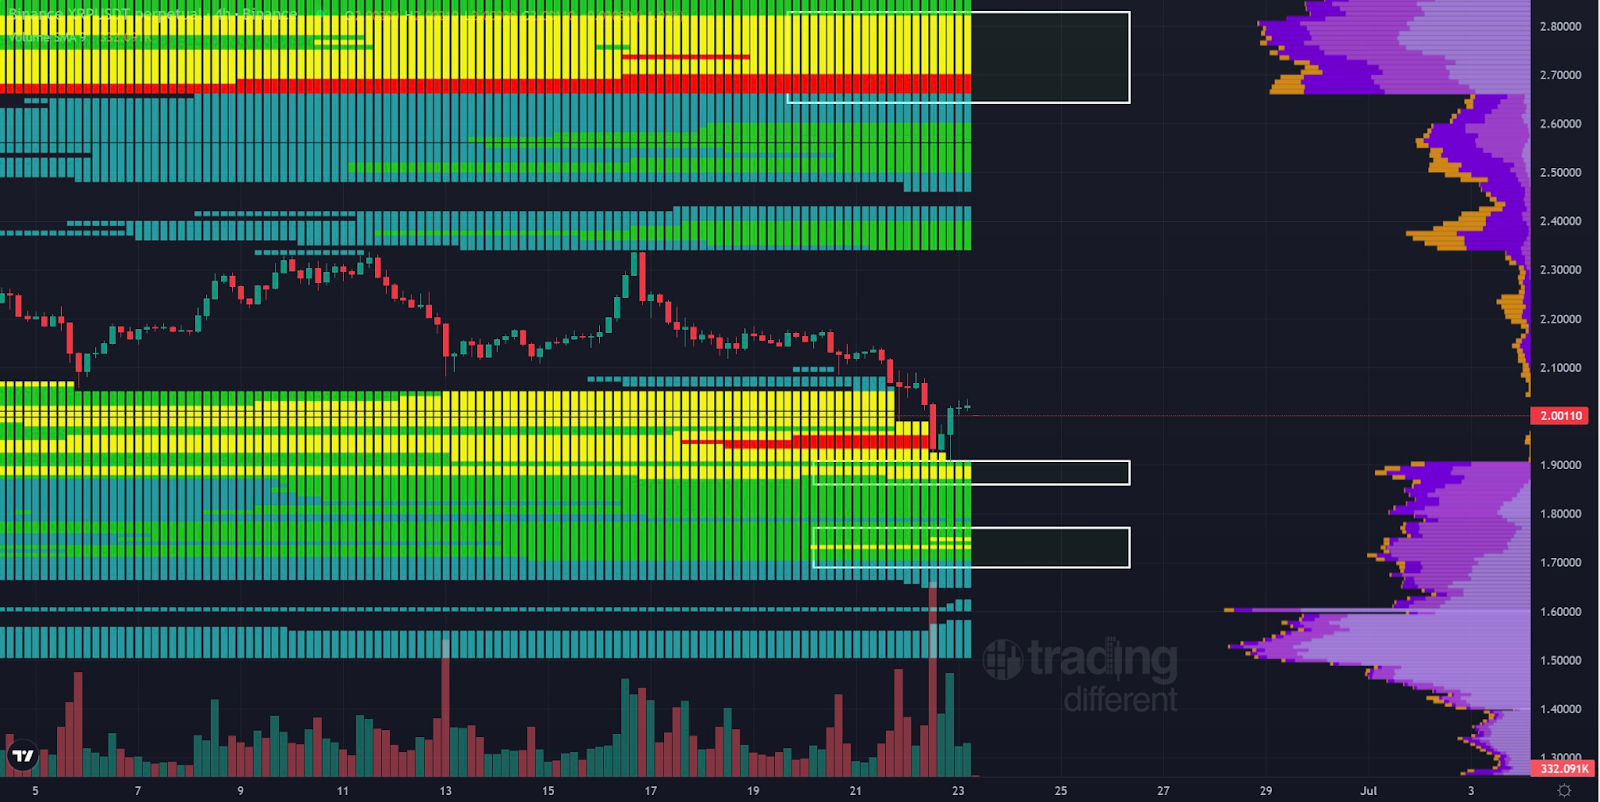
The point is, however, that above that, there is more and more dense liquidity between 2.10 and 2.30. The heatmap demonstrates that more and more order walls have tightened in this area.
Liquidity is clustered around the $2.16 and $2.28 levels. If the price drops below $2.05, it could trigger a liquidity wipe. On the upside, breaking above $2.30 may lead to stronger bullish movement. This is due to a thinner supply in that price range, as shown in the order book.
The heatmap’s volume profile on the right-hand part can prove this thesis. At its top, the biggest high-volume node (HVN) is between $2.00 and 2.10.
If XRP price breaks this fair value level, it could trigger stronger upward momentum. This is due to reduced selling liquidity above that threshold.
Futures Market Shows Structural Support on XRP Price
According to Coinglass, the future open interest of XRP is currently at a multi-month high, remaining at approximately $2 Billion. Market participants remain actively positioned despite recent spot price declines.
There’s been a steady increase in leveraged interest. The latest rise to around $2 Billion shows healthy, controlled growth. This is still well below the December 2024 peak of over $6 Billion.
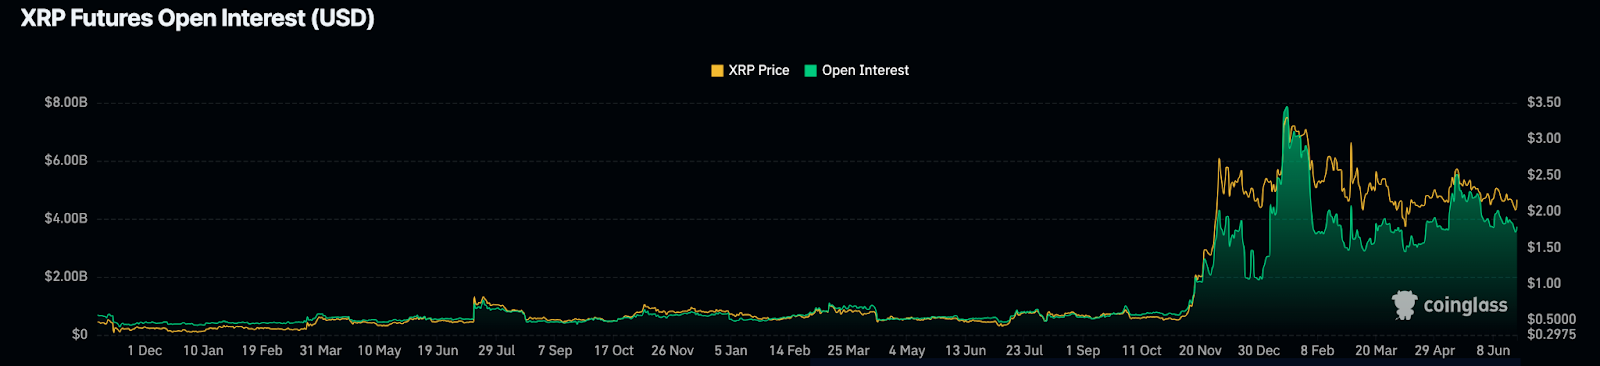
Open interest has remained relatively steady in recent sessions. This stability and the XRP price reclaiming $2.00 support the ongoing defensive momentum.
While open interest has dropped since early May, it hasn’t collapsed entirely. The decline began above $2.50, where activity was previously more intense. The scenario is a good indicator of long-term positions or options hedging.
Price Action and Moving Average Dynamics
The daily chart shows that the trend of XRP/USDT on Binance is bullish. Prices now range at $2.187 after rebounding off a low of around $2.00.
At press time, XRP price traded between its 100-day SMA at $2.222 and its 50-day SMA at $2.266. This positioning highlights a narrow technical range that could influence upcoming price moves. The 200-day SMA is placed behind at $2.374.
These moving averages are defined as a confluence of resistance between 2.22 and 2.37. These can serve as a ceiling area until a better volume and momentum cover it.
A daily close above $2.266 could strengthen bullish momentum. This might lead to a potential retest of the $2.50 resistance level soon.
MFI is also at 35.51, which shows that XRP is not overbought yet and can potentially receive capital inflows. The Average Directional Index (ADX) value, as indicated by 15.74, implies that the trend is not strong.
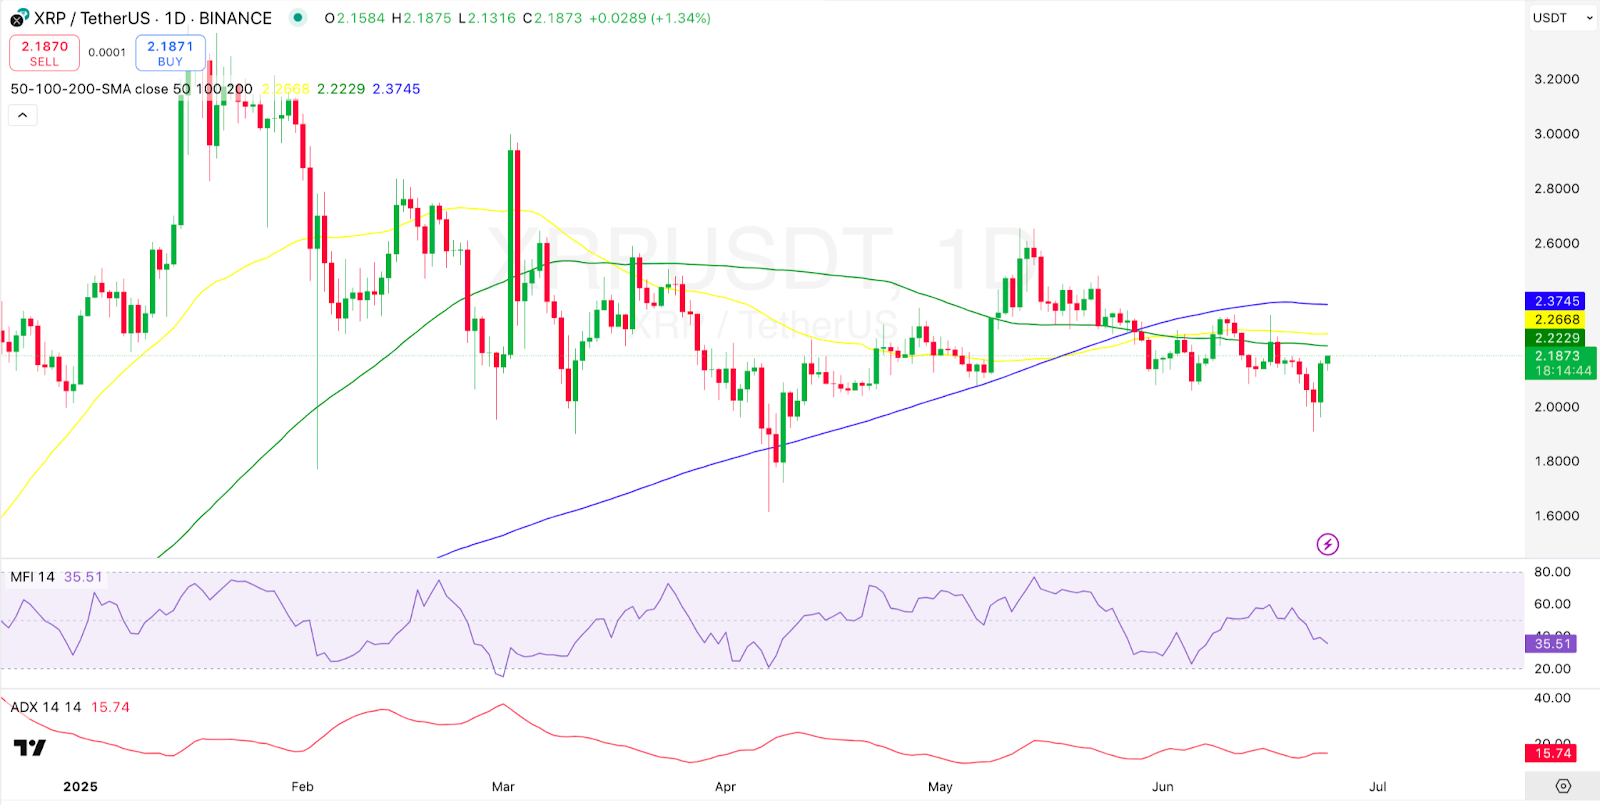
Volume analysis shows a moderate increase during the recent bounce. This is particularly evident in the June 21–22 candle range, reflecting growing participation in the move.
However, the extension has yet to approach the rates experienced during the significant breakouts in March and May. This indicates that any bullish extension can only be possible under a wider market catalyst or even a more bullish mood.
The technical design of XRP sits in a precarious mid-range area of consolidation. Since reaching a high of over $3.00, the XRP price has been making lower highs and lows.
The price action has formed a descending structure. This setup could lead to a larger corrective bottom or a breakout extension.
However, the new liquidity map should display tremendous stacking above $2.00 and tighter resistance at $2.20-$2.30. As XRP moves higher, stop-run levels may trigger along the way.
This could result in a wave of liquidations or spark a breakout rally. Despite this, its ongoing legal situations could also affect the price trajectory.
Disclaimer
This article is for informational purposes only and provides no financial, investment, or other advice. The author or any people mentioned in this article are not responsible for any financial loss that may occur from investing in or trading. Please do your research before making any financial decisions.




