Sword Inu
 no crying in the casino
 streamoors
 IGNITION
 Altai the Tiger
 Pearl
Pearl Quantus

Bitcoin price fell further on Wednesday after the expectation of a rate cut in December plummeted abruptly. That’s due to a sudden delay in the release of data by the U.S. Bureau of Labor Statistics.
The absence of the October jobs report, and November’s report is scheduled only after the next Federal Reserve decision. It means Chair Jerome Powell will head into the FOMC meeting “flying blind.”
This could prompt markets to assume a more cautious policy stance. The move has already driven Bitcoin to as low as $86,000.
According to the CME FedWatch bar chart, the odds of the December rate cut have decreased 31.8% to a 350-375 bps rate range. The markets have a 68.2% likelihood of the rates remaining at 375- 400 bps. These revised probabilities signify the abrupt retreat of earlier in the month.
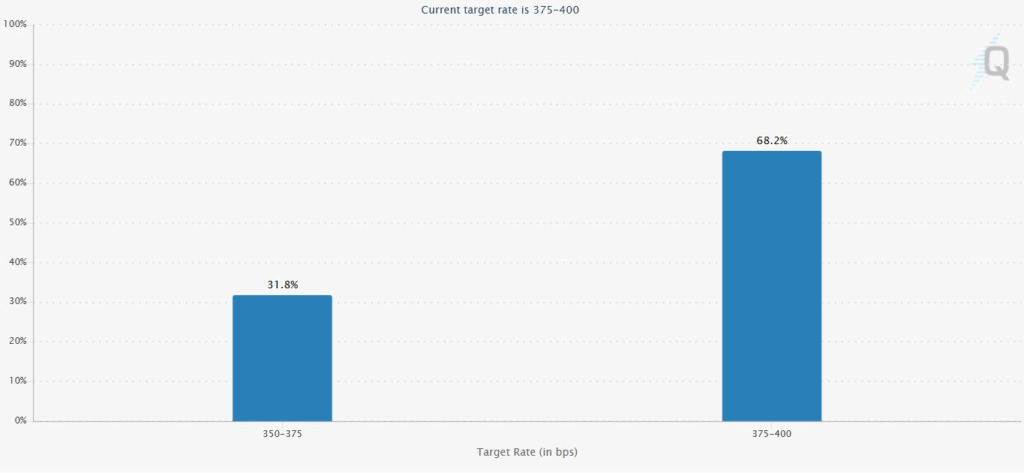
The retreat occurred when traders anticipated that incoming labor data would help guide a reduction. Powell’s missing such data might have caused a lower probability that an urgent easing was priced in by the market, and risk assets responded.
Bitcoin Price Drops Below $90K as Policy Expectations Tighten
CoinMarketCap data shows that Bitcoin price fell straight down after starting the day above the level of $92,000, reaching $85,456. This represented a 7.36% decrease in the past 24 hours. The relocation indicates a rapid shift in risk sentiment when rate expectations were reassessed.
Bitcoin has dropped 32%, as per the long-term correction data table, since it reached a peak of $126,273 on October 6. This makes the current drawdown comparable to several historical mid-cycle retracements.
The cycles include the 32% correction from January to April 2025 and the 33% decline from March to August 2024. The analyst stressed that the recent shift is within the established volatility model of Bitcoin, rather than an outlier event.
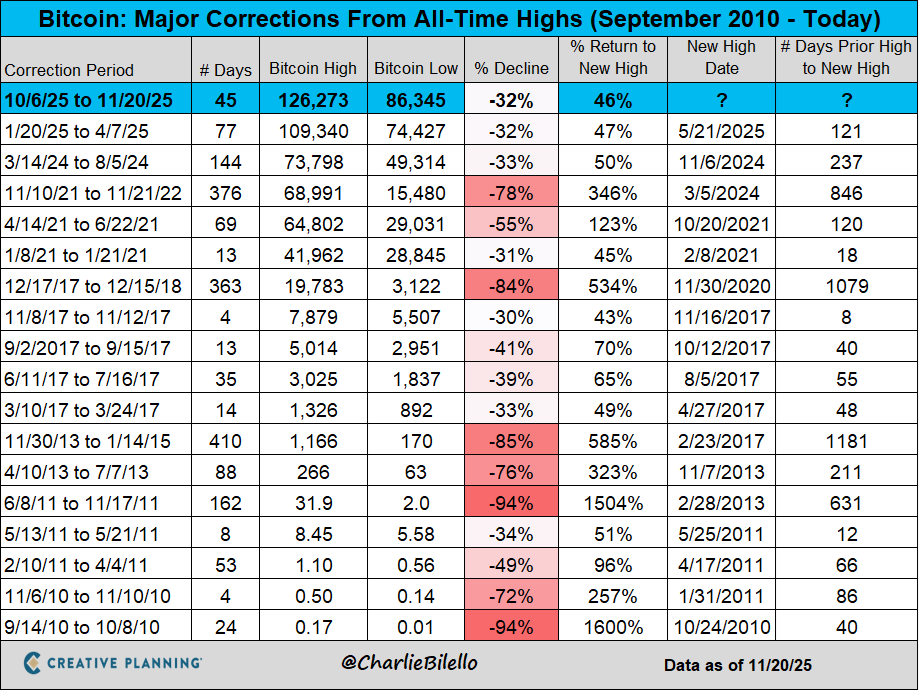
In the historical cycles since 2010, a decrease of 30%-55% has been the norm during mid-cycle consolidations.
The current 45-day drawdown, from October 6 to November 20, compares to other 45-day drawdowns, including the mid-2017 drawdown (13 days, -30%) and the multi-month 78-day drawdown of late 2021 (with different magnitudes). However, the magnitudes are very different.
Based on the table, it can be seen that Bitcoin has in the past taken a range of 18 and 846 days to recover new heights after significant corrections. The present drawdown is also of a lower severity and duration than historical norms.
The fact that it is normal structural behavior associated with heavy recessions, characteristic of earlier cycles of peak to trough.
Price Technicals: BTC Retests .618 Fib and Approaches Yearly Open
Bitcoin price activity on the daily chart shows an essential retest of the 0.618 Fibonacci retracement at a price range of $94,229. The market dropped below the 0.618 retracement level on Tuesday.
The chart indicates that there is a long bottom wick at $93,370, just over the Yearly Open. This is the final significant structural line before the area of $86,000.
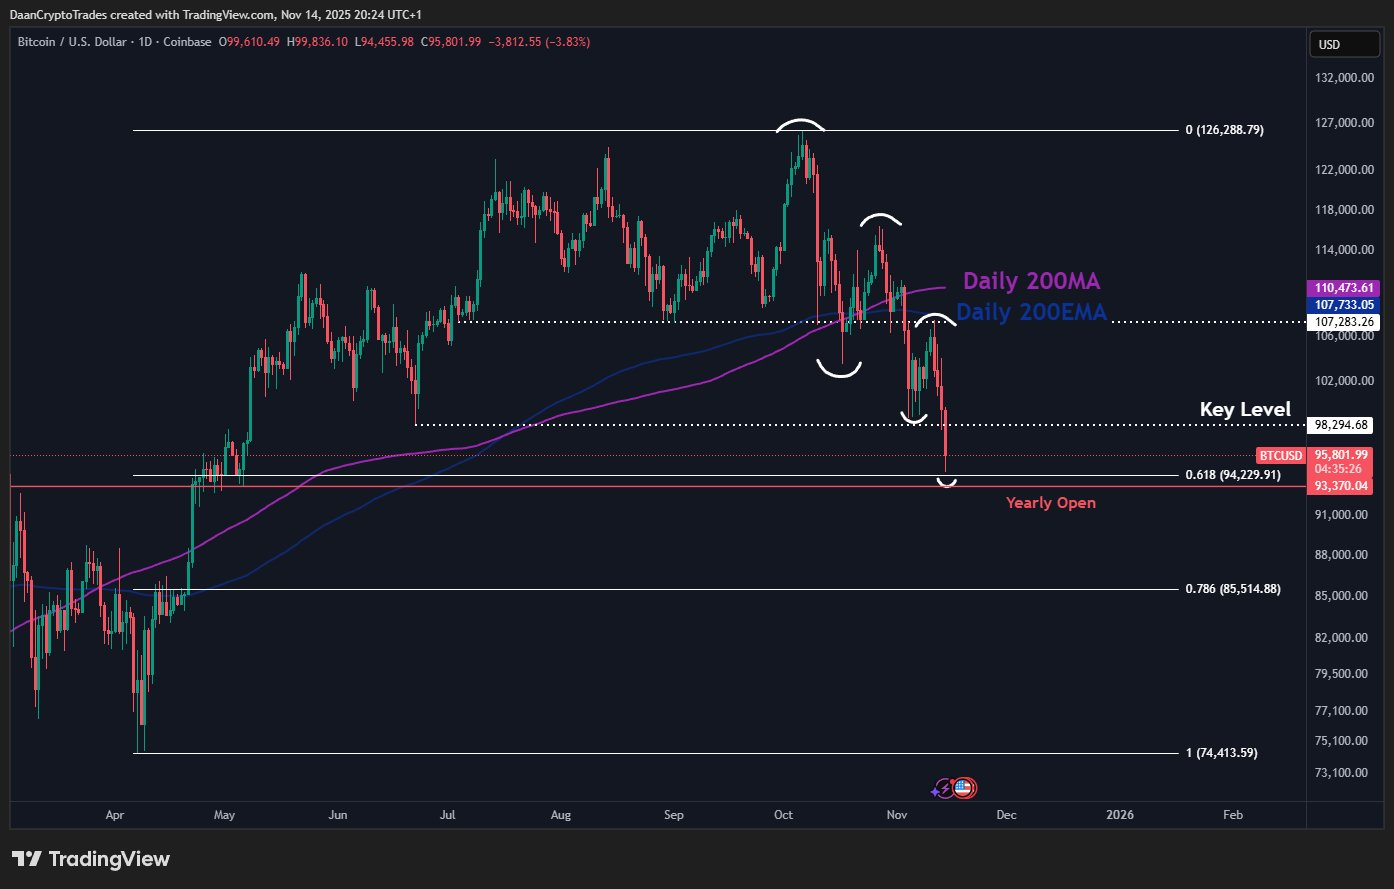
This analyst observed that the 0.618 level is historically associated with points where the price is trying to stabilize. However, this recurring retest through this cycle, coupled with such steep rate-cut repricing, resulted in further downside volatility.
Bitcoin price is currently below the daily 200-day moving average and the 200-day EMA. The EMAs were limiting recovery efforts during early November.
A set of lower highs between September and early November is also noticed in the chart. It has a structure of decline before the present break lower. The previous significant level of support is near $98,294. The zone currently acts as the overhead resistance and mirrors the overall trend reversal.