Dacity Coin
 Bitcoin
 Quantus
 Injective
 Pump.fun
 NEAR Protocol
 Pearl
Pearl

NEAR price declined this week to new multi-month lows, falling below the $1.80 area, following weeks of strong downward pressure. Near is now at the same level it was in October and November. Momentum now rests on whether it can regain the levels of $1.80 and $1.95.
Daily chart data indicate a consistent decline due to the resistance band from $3.00 to $3.60. The band has turned back several breakouts in 2024 and 2025.
Having previously failed to sustain the $2.20-$2.40 consolidation range in November, NEAR crashed down, accelerating, with conspicuously high selling volume on the break. The drop below $2.00 was met with a series of large-volume sessions.
This meant definite action on the supply side as the price moved downward towards $1.70.
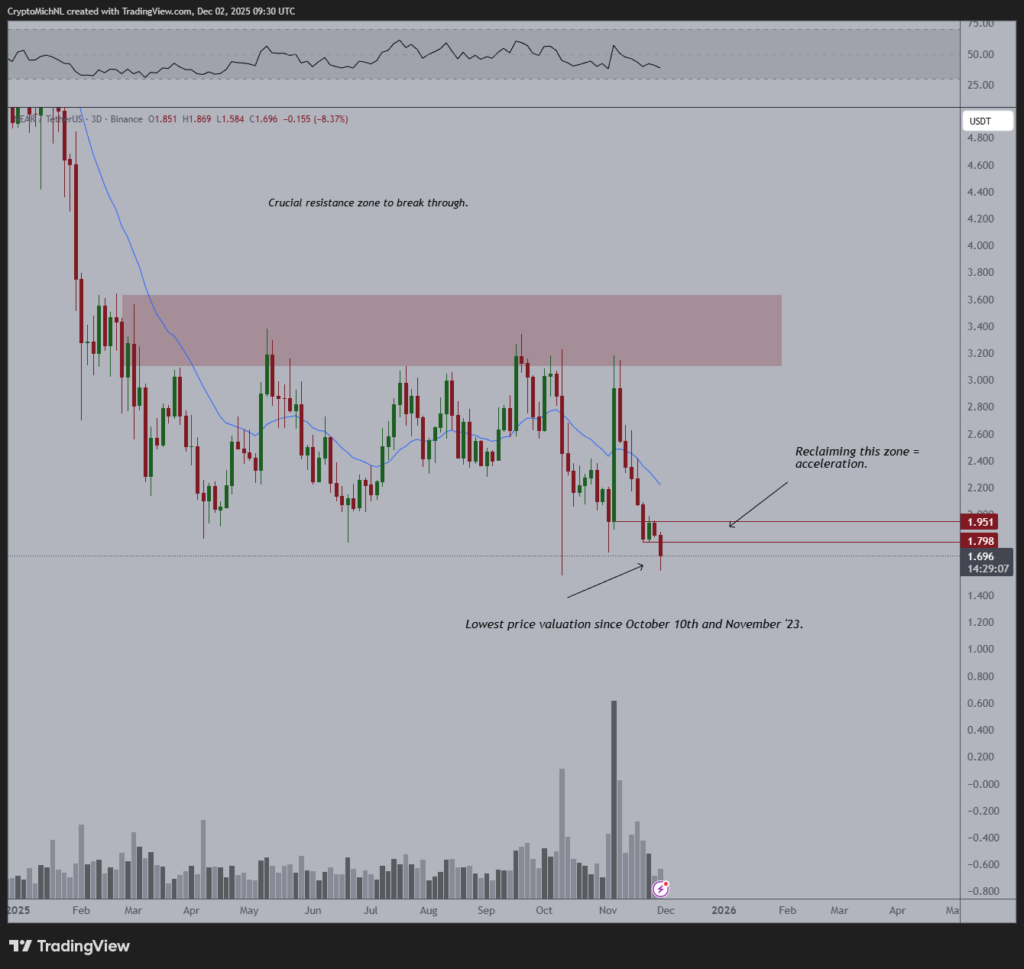
NEAR price has been able to defend $1.80 over July, August, and early October before further selloffs whenever the price approached the level. Its recent collapse led it to a resistance area. The resistance level needs to be revisited to return the market to its normal state.
The $1.95 level has acted as an acceleration zone in multiple past rebounds. During the recoveries in mid-July and early September, bullish continuation only occurred when NEAR managed to close the day above this level.
NEAR Volatility Levels Cooling Off
The 90-day annualized volatility chart supports this information, trending in a constant downward line since September. The highest volatility occurred near the period when NEAR was trading around 3.2, but it has narrowed steadily over the last two and a half months.
The volatility curve has dropped from $0.80 to the $0.40 area. It indicates that the intraday action was becoming more stable, despite the decreasing curve.
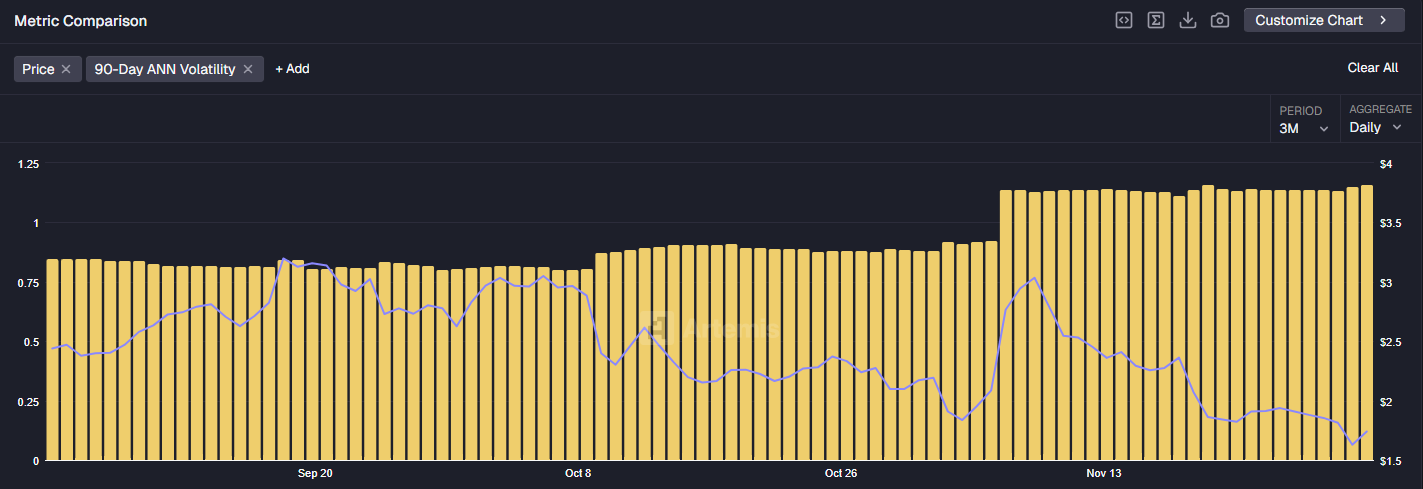
This suppressed volatility aligns with the formation evident on the daily chart. The falling of NEAR since the middle of November has not been violent, but rather gradual and regulated.
It shows a gradual unwinding of the previous demand, rather than the chaotic disposition of previous demand, as in a sharp capitulation. The subsequent decrease in the volatility as the price neared $1.70 is one of the lowest volatility rates of NEAR in 2025. That adds to the tight price action.
Long-Term Near Price Structure Highlights the Importance of $1.00
Weekly chart data provides a broader view of the NEAR price movement. That horizontal support around $1.00 determined the course of NEAR in the last cycles.
It also served as the platform for the 2023 consolidation and the rocket to the early 2024 uptrend that took the price into the mid-$4.00 zone. After almost one and a half years of oscillations, NEAR has slowly reverted to this form.
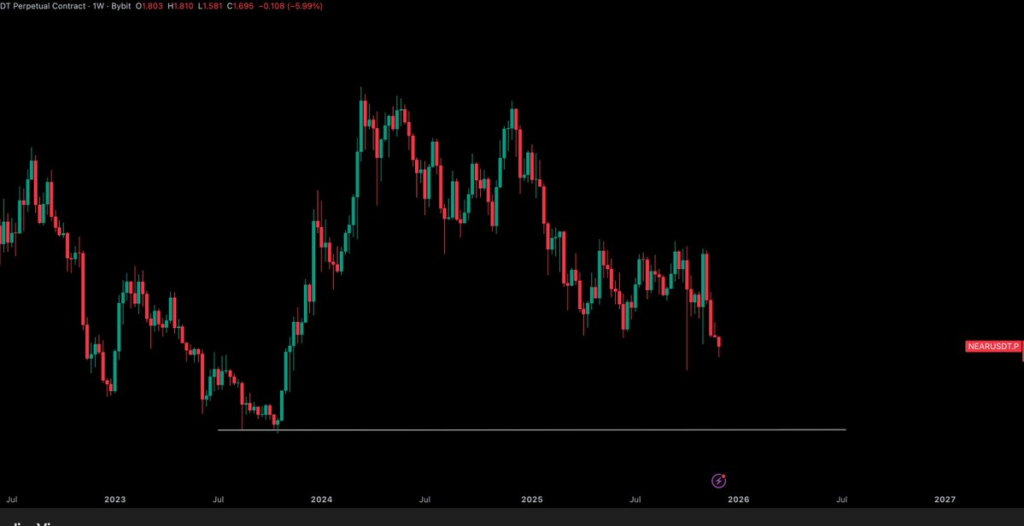
The current downward trend is a continuation of a sequence of low highs that have been formed since April 2024. With the price nearing the lower end of the long-term structure, the weekly pattern suggests that it is located in a historically reactive zone.
Institutional involvement also backs the possibility of a NEAR price rally. According to Grayscale Holdings data, NEAR is given a share of 26.69% of the AI portfolio. This distribution places NEAR in second position, second only to TAO, which owns 34.39% of the basket.
The remainder is spread out on Filecoin, Render, Story, and The Graph. However, the next step of NEAR will be majorly determined by its reaction with the levels of $1.80 and $1.95.