
 Sword Inu
 no crying in the casino
 streamoors
 IGNITION
 Altai the Tiger
 Pearl
Pearl Quantus

Bitcoin price surged toward $75,000 this week as short liquidations hit leveraged traders across crypto markets.
The move followed renewed optimism around U.S.-Iran talks, which lifted broader risk sentiment. However, analysts warned the rally lacked strong structural support and could reverse sharply.
The crypto market added fresh value as liquidations wiped out bearish positions and forced rapid covering.
This shift occurred because traders closed shorts under pressure, pushing prices higher without sustained buying demand. Bitcoin price strength in this phase reflected positioning dynamics rather than a broad capital inflow.
Bitcoin Price Rally Driven By Liquidations
CoinGlass data showed that roughly $530 million in leveraged positions were liquidated over 24 hours, affecting over 177,000 traders.
Most of these liquidations hit short positions, which amplified upward price movement. The move followed a concentrated squeeze period where derivatives traders exited positions rapidly.
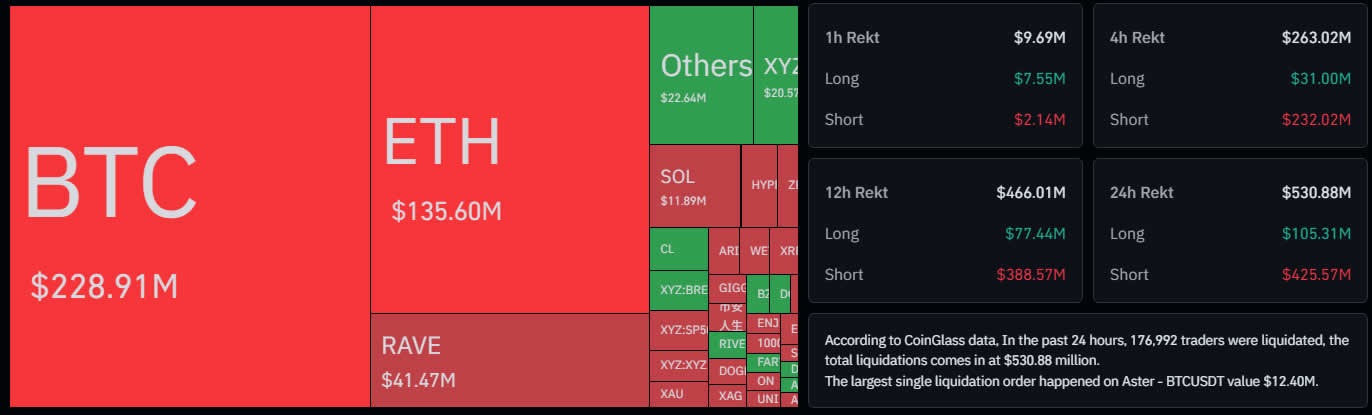
Valerius Labs noted that the rally did not reflect a structural breakout but instead a reaction to forced buying.
Their assessment pointed to overhead resistance levels where sellers remained active. That reaction mirrored past short squeezes, where temporary momentum faded once liquidation pressure eased.
Ivan Liljeqvist, a trader and analyst, argued that Bitcoin price had not yet completed its broader correction phase.
He said the earlier drop failed to produce a full capitulation event, leaving downside risk intact. His view aligned with other analysts who saw current bounces as weak relative to prior bull cycles.
Bitcoin Price Weakness Seen In Derivatives Data
CryptoOnchain data showed a divergence between Bitcoin (BTC) price movement and Binance open interest trends during recent weeks.
While price rose within a short-term channel, open interest declined sharply, indicating reduced leverage participation. This shift occurred because traders closed positions rather than opening new ones.
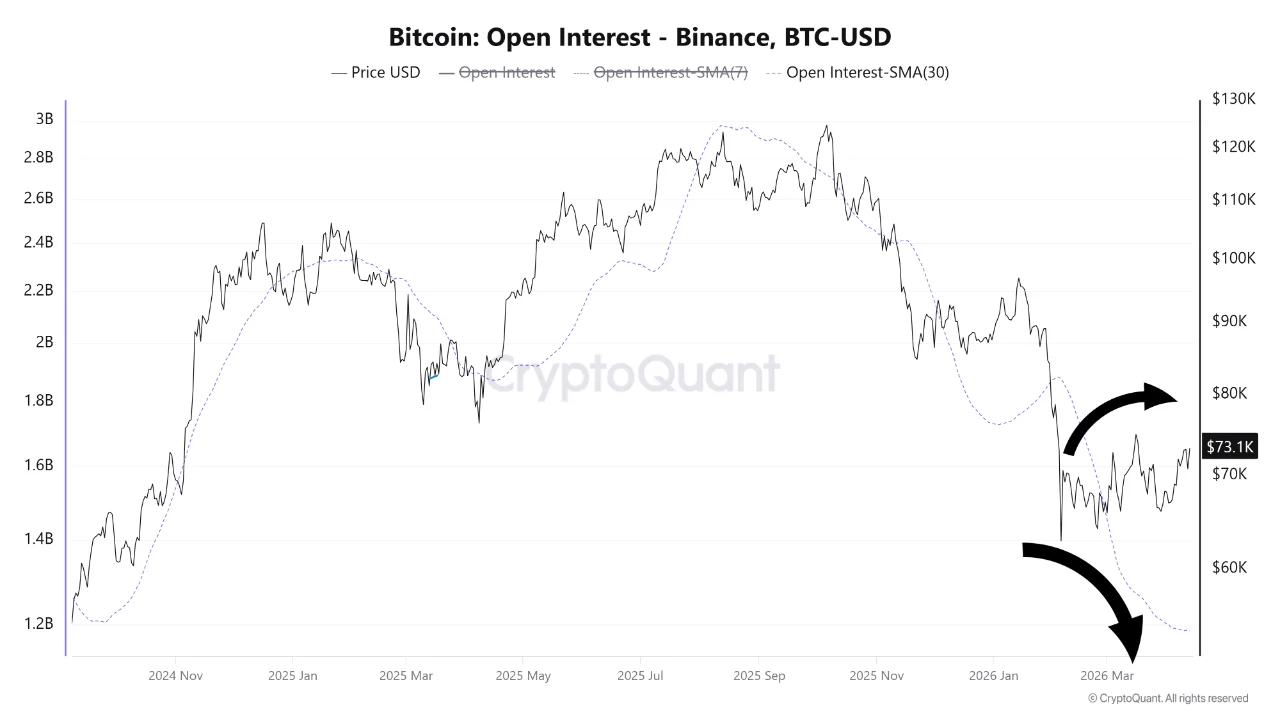
The 30-day average open interest dropped from 1.9 billion to 1.19 billion during the same period.
That decline suggested the rally relied on spot buying and short covering rather than new speculative bets. Such conditions often limit sustained upside momentum in the absence of fresh capital.
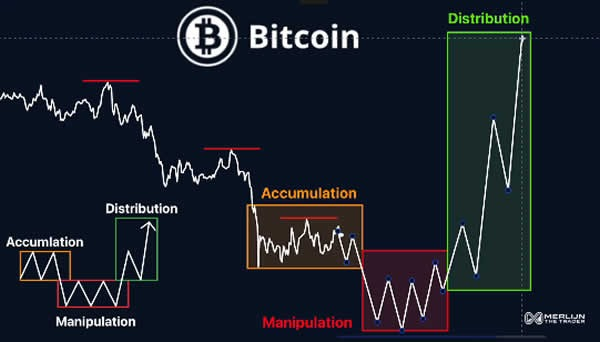
Analyst Merlijn Enkelaar described the current structure as a transition into a manipulation phase within a broader cycle.
He outlined a sequence in which accumulation preceded a volatility-driven move lower, followed by distribution. His framework implied that Bitcoin price could revisit deeper levels before stabilizing.
Nick Ruck, research director at LVRG, said market participants viewed the $50,000 zone as a final accumulation range.
He argued that a move into that region would represent a reset phase within the cycle. That interpretation suggested long-term positioning might emerge only after a deeper correction.
Macro And Structural Pressures Remain
Market sentiment improved after geopolitical tensions eased, which supported risk assets in the short term.
This reaction mirrored historical patterns where easing uncertainty lifted speculative markets. However, analysts maintained that macro pressure still constrained sustained upward momentum.
Bull Theory data showed that short liquidations added over $100 billion to total market capitalization during the rally phase.
This expansion occurred quickly and did not reflect steady capital allocation into crypto assets. As a result, the market faced the risk of retracing gains once forced buying subsided.
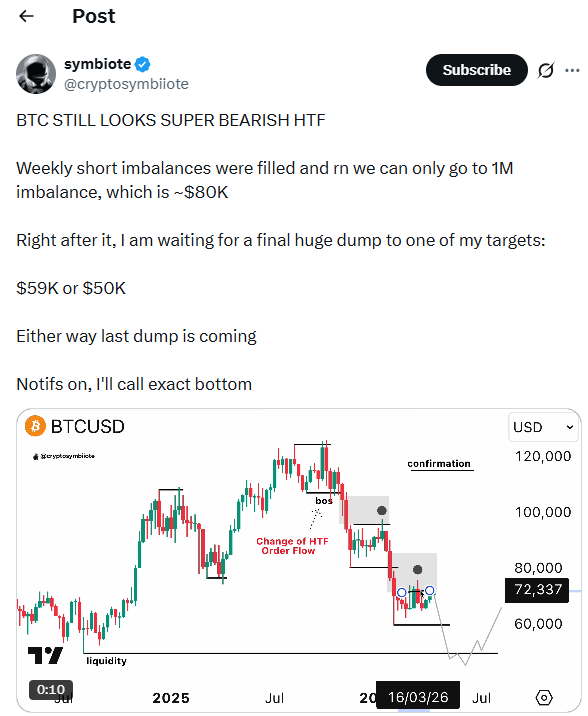
Another analyst, known as symbiote, stated that high timeframe trends remained bearish despite recent gains.
He expected a final downward move toward key targets before a broader recovery could begin. Jelle also identified a bear flag pattern still in play, which typically signals continuation lower.
Bitcoin price now faces resistance near the 200-day simple moving average, where sellers have historically returned.
If momentum fades, the market may test lower support zones highlighted by analysts. A confirmed reversal would likely require renewed inflows into derivatives markets to validate strength.



