streamoors
 IGNITION
 NEAR Protocol
 Injective
 Pearl
Pearl LayerZero
 Quantus

The MSTR stock price bounced back by over 3% on Monday as investors bought the dip and as Bitcoin moved back above the key resistance level at $110,000. Still, as the MicroStrategy stock jumps, there is a risk that this is a dead-cat bounce.
MSTR Stock Price Technicals Point to a Dead Cat Bounce
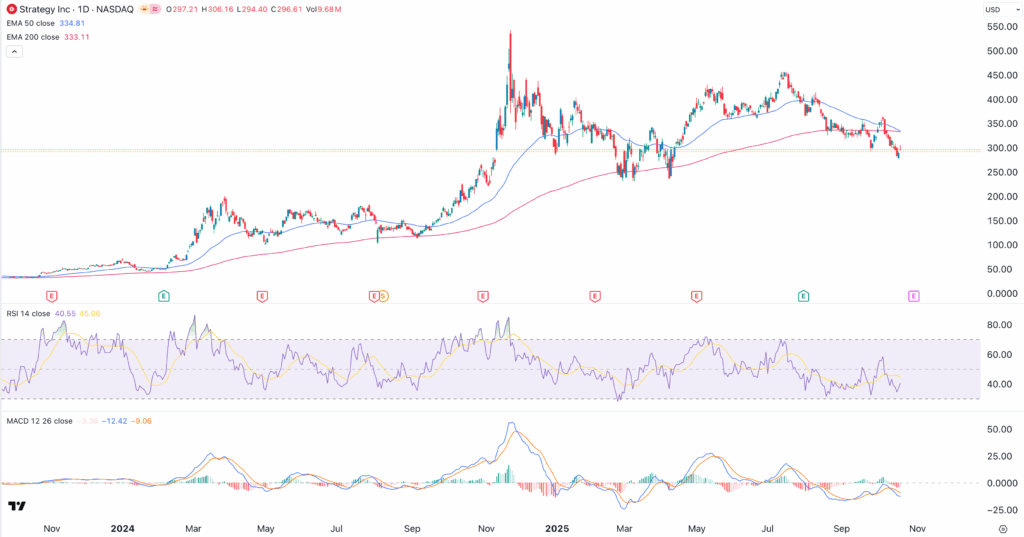
The daily chart shows that the MSTR stock price peaked at $458 in July and then started strong downward trend. It crashed and bottomed at $278 last week as Bitcoin price plunged to a multi-month low.
Strategy stock jumped to a high of $300 on Monday as investors bought and as Bitcoin and the crypto market improved. It also moved slightly above the important resistance at $292, where it formed a double-bottom pattern.
Still, the stock price may resume the downward trend in the coming weeks. For one, there are signs that the stock is about to form a death cross pattern, which happens when the 50-day and 200-day Exponential Moving Averages (EMA) cross each other. This is one of the most common bearish continuation patterns in technical analysis.
The other main risk is that the stock has plunged below the Ichimoku cloud indicator, a sign that bears are in control. On top of this, the Supetrend indicator has turned red, confirming the downtrend.
Top oscillators like the Relative Strength Index (RSI) and the MACD indicators have continued to turn downside. Therefore, the most likely scenario is where the MSTR stock drops and moves to the next key support level at $230, its lowest level in March this year.
On the other hand, a move above the resistance level at $335, its 200-day Exponential Moving Average (EMA) will invalidate the bearish outlook and point to more upside in the coming months.
MicroStrategy Faces Potential Risks Ahead
There are reasons to believe that the MicroStrategy stock price will resume the downward momentum in the near term.
First, the Bitcoin price has formed a giant rising wedge pattern on the weekly chart, pointing to a potential bearish breakdown. This pattern is made up of two ascending and converging trendlines, and is one of the most bearish signs.
The stock has also formed a double-top pattern at $124,270 and a neckline at $107,050. Like the wedge, this pattern normally leads to a strong bearish breakdown as it signals that bulls are afraid of placing bids.
The distance between the double-top point and the neckline is 13.8%. Measuring the same distance from the neckline gives it a target of $91,945. More Bitcoin downside will lead to a strong decline of Bitcoin treasury companies like MicroStrategy.
Falling mNAV Multiple is a Risk for Strategy Stock
The other main risk is that MSTR stock is its that its net asset value mNAV multiple has continued falling this year and is currently at 1.162, while the enterprise value NAV has dropped to 1.36. These numbers have dropped from their all-time highs of over 8.
Tumbling NAV multiple is a sign that demand for the stock continues falling this year. It also mirrors that of other Bitcoin treasury companies like Metaplanet, Semler Scientific, and KindlyMD. Metaplanet, whose figure jumped to a high of 8 to below 1.
Falling NAV multiple is risky as it effects how the company raises money, which it uses to buy Bitcoin. This explains why the company has reduced the amount of Bitcoin it buys. Strategy bought 168 coins worth $18.8 million, down from the 220 it bought in the previous week.
Summary
MSTR stock price has been on a freefall in the past few weeks as demand for Bitcoin treasury companies faded. It then bounced back slightly on Monday as the crypto market rebounded. However, there is a risk that the ongoing rebound is part of a dead-cat bounce.